

Highlights
Key Takeaways
- When Does Bad Economic Data Become Bad for Stocks?
- Weekly Market Preview: An Important Week: Fed Decision (Including the Dots), CPI and AI Updates.
- Do We See Real Movement in Rate Cut Expectations?
- Special Reports and Editorial: What Is the Smart Market Telling Us?
Stocks
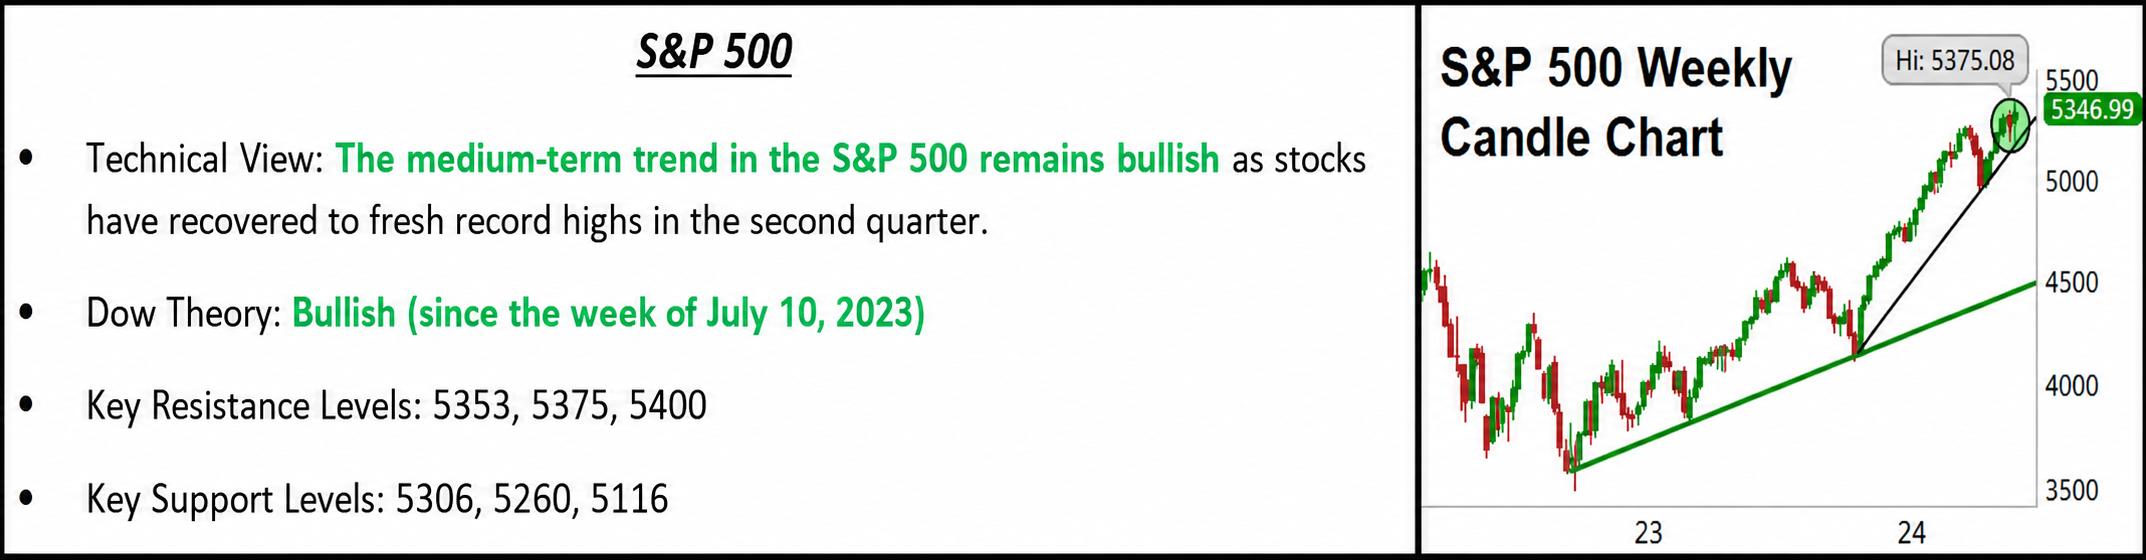
“The S&P 500 hit a new all-time high last week thanks to more AI enthusiasm and mostly Goldilocks economic data.”
✓ What is Outperforming: Defensive sector, minimum volatility, and sectors linked to higher rates have relatively outperformed recently as markets have become more volatile.
✓ What is Underperforming: Tech/growth and high valuation stocks have lagged as yields have risen.
S&P 500
When Does Bad Economic News Become Bad For Markets?
Markets have been volatile to start the month thanks to conflicting economic data, as initially soft data increased rate cut expectations, and that, combined with surging AI enthusiasm, pushed the S&P 500 to new all-time highs. However, those gains were partially reversed as strong economic data (ISM Services and the jobs report) pushed back on rate cut expectations.
For now, bad economic data remains good for stocks and bonds while good economic data is a negative for stocks and bonds, again because markets are trading off shifting rate cut expectations. But before Thursday’s solid ISM Services PMI, there was some chatter in markets that bad economic data might start to be bad for markets. That did not happen last week, but it begs an important question: When will bad economic data become a negative for stocks?
The answer is: Bad economic data will become negative for stocks when the data is so bad that it sparks legitimate growth worries. To be clear, that did NOT happen last week (it may have happened if Thursday’s ISM Services PMI and jobs report were soft). Nevertheless, it is important to realize that while data is not at that point yet, it is moving in that direction and as a result, slowing growth remains the biggest risk to this market (and it is not as insignificant a risk as the new highs in stocks imply).
Reasonably, one might think, “If growth risks are building, why are stocks at new highs?” There are two reasons for this:
First, AI. AI mania continues unabated, and the truth is that generic product updates from AI-focused companies (the next one is AAPL this week) still are effective at pushing the tech sector and the entire S&P 500 higher.
Second, rate cut expectations. The market is still primarily driven by Fed rate expectations and if rate cut expectations increase (as they did last week) that more than offsets any concerns about growth. Until those factors are eliminated (by AI hype finally getting overdone or data turning decidedly worse) stocks can rally despite the totality of economic data pointing towards a slowing of growth.
Because our focus is beyond the short term, our investment team continues to believe that maintaining long exposure while also actively trying to reduce volatility in portfolios remains appropriate and that continues to be best done via defensive sectors, quality factors and lower-volatility styles.
We are looking forward to the Fed and the CPI print, which will be in focus and lower yields will equal higher stocks. However again, amidst that potential enthusiasm, the outlook for growth is deteriorating and we will continue to point out that reality.
Economic Data
What You Need to Know in Plain English
Last week gave us the three most important economic growth reports of each month and this week will give us the most important inflation reports of each month and a Fed decision with updated dots. Both events occur on Wednesday, and both could substantially move markets if there are any significant surprises. Since Fed expectations are the influence over this market, Wednesday’s Fed decision is the most important event of the week.
The bottom line is there is no chance of a rate cut and the focus will be on the updated dots (specifically if they still show three rate cuts, two or just one). Obviously, the Fed decision has the potential to substantially move yields, which in turn will move stocks.
Turning to CPI, to a point it is overshadowed by the Fed decision that will come just five and a half hours after its release, but it still matters.
The bottom line is at these levels, markets are pricing in a continued decline in inflation, and even with last month’s small drop, the reality is the decline in inflation has largely stalled. That must resume in earnest if we are going to see yields meaningfully decline and current valuations in stocks become more reinforced.
Finally this week, Thursday’s jobless claims will continue to be more closely watched as they continue to slowly drift higher. Again, they are not close to levels we would consider negative for the economy, but they are trending higher and if that continues it will be another signal that the economy is truly losing momentum.
Bottom line, Wednesday is the critical day this week and for stocks to hold this month’s gains we need to see the Fed and CPI confirm that 1) Rate cuts are coming sooner than later and 2) Inflation is once again meaningfully declining.
Commodities, Currencies & Bonds
“Commodities declined sharply last week after OPEC+ failed to impress the market at its recent meeting while global economic growth continues to show signs of cooling off.”
Commodities started the month with a surge in volatility as oil traders reacted to OPEC+’s June production policy meeting in a bearish manner (a 4%-plus selloff) while a plunging dollar supported metals. Early month moves were digested and largely retraced into the jobs report Friday before commodities sold off on the hot/hawkish jobs report.
Energy has been front and center as the OPEC+ decision to extend collectively mandated production cuts through the end of 2025 largely met expectations. However, their decision to open the door to curbing some of the voluntary cuts that have been critical in keeping the physical oil market balanced and prices elevated in recent years was met with skepticism and traders sold futures first and asked questions later.
Over the course of the last week, EIA data pointed to a pullback in consumer demand but a still-upward trend in the four-week moving average of the implied gasoline demand, while refining activity was up more than expected. That combined with several heavyweight officials within OPEC+, including those from Saudi Arabia and Russia, saying that the market reaction to their June meeting decision was “overdone,” helped oil recover into the jobs report. The trend in oil has effectively turned sideways in the early summer but if the downtrend off the April highs is violated, the benefit of the doubt will return to the bulls.
Gold
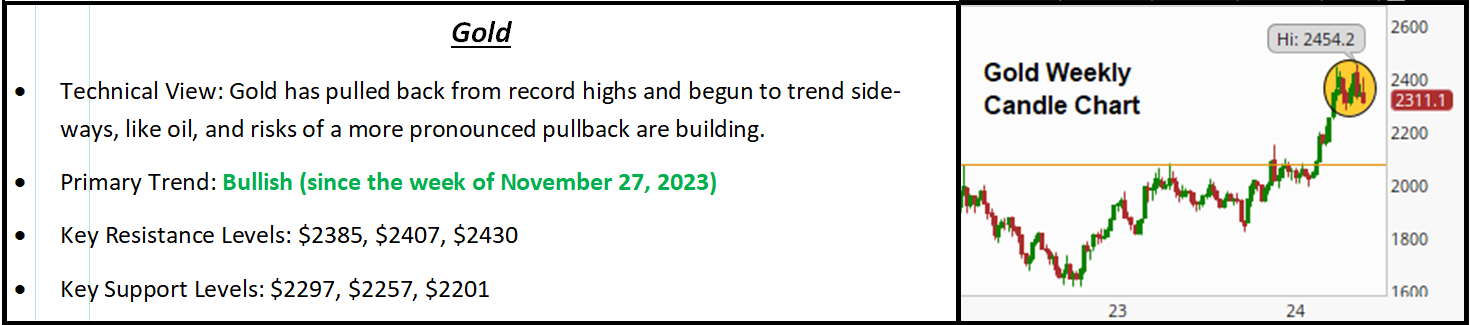
Gold ended the week down 1.56%, plunging 3.34% on Friday in the wake of the jobs report. Gold was higher coming into Friday thanks to the weaker dollar and new multi-month lows in bond yields, which acted as a familiar dual tailwind. Money flows reversed on the jobs report, however, and gold ended the week just above a key technical tipping point at $2,300/oz., and a close below there will shift the outlook for gold to bearish.
“The Dollar Index was volatile last week but ended with little change as initially weak economic data was offset by a hot jobs report and Fed rate cut expectations remained mostly consistent (a September cut is possible but not likely).”
For all the volatility, the outlook for the dollar and Treasury yields remains largely stable. The Fed is still viewed as the most hawkish major global central bank and that was again proven last week when the ECB and Bank of Canada cut rates. Until that view of the Fed changes (or the view of other central banks changes) the Dollar Index should remain in the “neutral” level around 105.
Turning to Treasuries, for now the short-term inverse relationship between yields and stocks remains in place. If yields rise that will be a headwind on stocks and if yields fall, that will be a tailwind on stocks. This will remain in place until economic data gets bad enough to spark genuine growth worries, and our investment team believes we are just not there yet.
10-Year T-Note Yield Futures
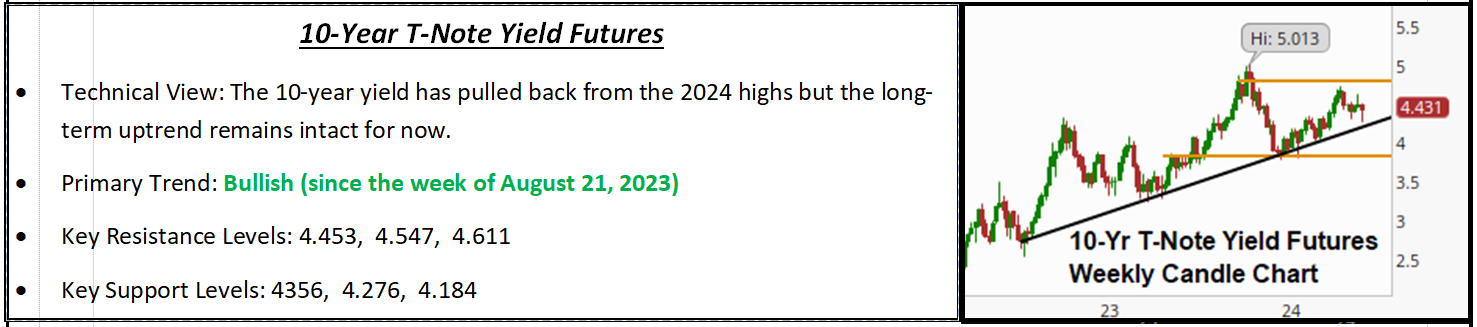
“The 10-Year Treasury yield rose 4 basis points last week but finished well off the lows of the week (below 4.30%) courtesy of the hot jobs report on Friday.”
Special Reports and Editorial
What Is the Smart Market Telling Us?
The elephant in the financial room is that the Treasury market remains to have a deeply inverted yield curve, a dynamic that has an unmatched track record in predicting recessions. The current yield curve inversion is notably the longest on record, which is one thing that actually is officially “different” about this economic cycle. It is important to point out that stocks tend to continue rallying through yield curve inversions and it is not until we see yield curve spreads begin to rise back to positive territory that recession concerns become a harsh reality and negative earnings revisions paired with multiple compression set the stock market up for a painful bear market.
What Has the Yield Curve Been Doing Lately?
In 2024, the spread between the 10-year Note yield and the 2-year Note yield (the 10s-2s) has steadily declined, hitting a fresh 2024 low of -47 basis points in late May thanks to hawkish money flows driving shorter-duration yields (those sensitive to policy rates) towards cycle highs while longer-duration yields (those more sensitive to economic growth and inflation) remain a comfortable distance from their respective cycle highs.
So What Does That Tell Us?
This exercise of diving into the intricacies of the fixed income market, which is inherently more sophisticated than the equity market (note that there are no “meme bonds” only “meme stocks”) and subsequently has market-leading tendencies, reveals that the bond market is steadily growing more concerned about two things. The first is that a higher-for-longer Fed policy, which was once just a widely held fear, is actually coming to fruition, underscored by the 2-year yield revisiting the 5% mark last month. Second, the risk of a slowdown or recession that could send the stock market down into an official correction (20% or more or worse) is beginning to rise materially given the significant distance between where the 30-year Bond is trading right now (4.40%) and its October 2023 peak of 5.11%.
A lot of stock market insight can be gleaned from movements in the bond market; and looking at the latest developments in outright yields and yield curve spreads suggests that Fed policy is still rather restrictive and the risks to economic growth are rising significantly, a dynamic that threatens the 2024 bull market in stocks.
Meanwhile, the price action in corporate bonds can also offer invaluable insight into underlying risks and opportunities in the stock market (long-time readers will recall that we have repeatedly used the high-yield bond ETF JNK as a leading indicator during times of uncertainty).
When it comes to analyzing corporate bonds, some of the most actionable takeaways are derived from credit spreads and their underlying trends. As a refresher, credit spreads are the difference between “risk-free” government bond yields and the benchmark yield for a given quality of corporate bonds. The most common credit spreads bond traders keep an eye on are the spreads between investment grade corporate bond yields and benchmarked Treasury yields, and the spread between high-yield or junk bond yields and their respective benchmarked Treasury yields (the benchmarking has to do with the duration of the corporate bond basket). Tight or low credit spreads are consistent with strong risk appetites while wide or higher credit spreads are associated with risk-off and uncertain environments.
Right now, credit spreads are just off their tightest levels of the cycle, but notably did not compress to new lows in late May when the S&P 500 rallied to new record highs. In cross-asset analysis that is a divergence to note and keep tabs on as it is not a dynamic that can last forever and sooner or later something has to give. Usually, it is stocks correcting in the direction of the move in credit spreads.
Additionally, looking at the outright level of the benchmark yield for investment grade or junk-rated corporate bond baskets can indicate the level of demand for corporate bonds and subsequently the general risk appetite among more sophisticated fixed-income investors largely in real-time as the St. Louis Fed’s “FRED” website updates credit spreads and corporate bond yield indexes daily.
One of the most interesting takeaways from executing this fixed income analysis was the reality that junk-rated corporate bond yields, those that are the riskiest and are the most similar in trading nature to equities as far as risk and volatility are concerned, are actually higher so far in 2024 (reflecting lower bond prices). Part of the reason for that is the fact that Treasury yields themselves are mostly higher so far in 2024, which puts upward pressure on corporate debt yields. However, with stocks up 12%+ YTD we would expect to see further and continued compression in credit spreads if risk appetites were so sustainably strong.
The fact that we are not seeing tighter spreads and lower junk-rated bond yields is another noteworthy divergence that suggests the latest leg higher in the equity markets may not have as much conviction behind it as the consensus believes right now, and risks of a growth-induced reversal in junk bonds, and ultimately equity markets, is higher than current market prices reflect.
By Vann Equity Management