

Highlights
Key Takeaways
- What’s Happened with the Bank Failures?
- What the Government Response Means for Markets
- Is This A Bearish Gamechanger?
- CPI Preview
- Oil Market Update
- Special Reports and Editorial:
- What Powell’s Comments Mean for Markets
- Fed Pause Playbook
Stocks
S&P 500
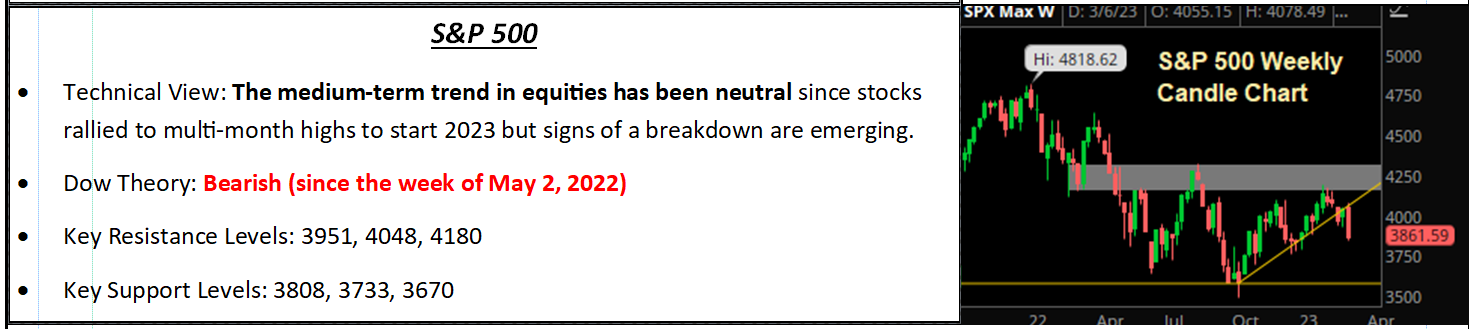
The fallout from the Silicon Valley Bank failure has dominated market news over the past weekend and as such we are reaching out to focus on:
1) What’s happened with SVB and other banks 2) Why it’s happening 3) If Fed actions over the weekend solves the budding crisis 4) Impact on monetary policy and inflation 5) If this is a bearish gamechanger.
What’s Happened with the Bank Failures?
On Friday Silicon Valley Bank, the 16th largest bank in the U.S., failed and was seized by the FDIC, marking the largest bank failure in the U.S. since Washington Mutual during the financial crisis. Then, on Sunday, Signature Bank of New York (SBNY) also failed and was taken over by the FDIC. Like Silvergate Capital and SVB, Signature Bank had a lot of crypto exposure. In sum, three large banks failed in less than a week.
In response, on Sunday night the Fed and Treasury Department announced that 1) All depositors at SVB and SBNY, including FDIC insured and non-insured, will be made whole and have access to their deposits today. 2) In a flashback to the financial crisis, the Fed has created a new lending facility, the Bank Term Funding Program (BTFP), which will provide one-year loans to banks and accept Treasuries and agency mortgage backed securities (Fannie/Freddie MBSs) as collateral, and the lending facility will value the bonds at par (not current market values—this is important).
Do The Moves by the Government Solve This Crisis? No, But They Help.
There are two main risks associated with what’s happening:
First is a local economic risk. Thousands of companies have money at SVB and SBNY and the vast majority of them have deposits in excess of the $250k FDIC limit. So, if those uninsured deposits are lost, then they will have no money to meet payroll, pay suppliers, etc. So, there’s a real economic risk here.
The second risk is much bigger. SVB and SBNY failed, in part, because of a lack of interest rate risk management. These banks bought long dated bonds over the past several years and didn’t manage their duration or interest rate risk. So, as rates rose over the past year and longer dated bonds dropped in value, it eroded their capital base and bonds they valued at par (100) were worth nothing close to it. This is likely a problem of varying degrees across most (if not all) banks in the U.S. and represents a real threat to the system should a large-scale run develop.
However, the Fed has removed much (not all) of this risk by accepting these bonds from banks at par, thereby eliminating the need for a bank like SVB or SBNY to fire sale U.S. Treasuries or MBSs during times of stress.
However, while this lending facility does significantly reduce the chances of a larger bank run, it will not eliminate immediate stress on the banks, especially the regional banks (they’re at the heart of this crisis).
The core issue going forward is the liability associated with uninsured deposits (deposits in excess of $250k). The government’s response to SVB and SBNY does not guarantee uninsured deposits across the banking system, and they are still at risk. So, we should expect a lot of deposit movement in the coming days (companies and people moving money to diversify risk and try and get close to, or under, that $250k level). That could easily result in more stress to banks and no one should be surprised if we see more regional bank failures this week.
Bottom line, the government response (guaranteeing all deposits at SVB and SBNY and creating the BTFP) helps and makes a broader bank run extremely unlikely, but it doesn’t solve the problem of 1) Bonds that have lost value and 2) Risk associated with uninsured deposits.
Will this Make the Fed Less Hawkish? The market thinks so, but our investment team is not so sure.
The market is aggressively pricing that this whole saga will make the Fed less hawkish, as fed fund futures are pricing in a 25% chance of no rate hike in March and a terminal fed funds rate of just 4.625% (meaning this hike in March will be the last one).
Our team is not so confident with this assessment. The banking stress is a risk, but inflation is still at 6%, and creating the BTFP will expand the Fed balance sheet at a time when it is trying to shrink it (the Fed is actively engaged in Quantitative Tightening).
Barring this regional bank stress metastasizing into a full-blown national banking crisis (something that is very unlikely) we do not think the Fed will stop hiking rates in the near term, and if anything this could end up ultimately providing stimulus to the economy and cause the Fed to hike more in the longer run.
Is this a Bearish Gamechanger and a Reason to Raise Cash? Not Yet.
The natural reaction to this weekend’s headlines is to make a parallel to 2008, but we do not think that is appropriate because in the end, the underlying assets at these regional banks are money good (they are U.S. Treasuries and MBSs and the housing market is not collapsing). Meanwhile, regulation of larger banks is more stringent, and the government is ready to act to help (as we saw this weekend).
We think the better analogy is the savings and loan crisis of the late 1980’s, where a sub-set of banks with direct exposure to an industry (in that case oil and gas) failed, and it created ripple effects across smaller lenders, but never threatened the broader banking system. That situation did not cause material market stress or declines.
Stepping back, we have taken conservative positioning, using rallies to ensure appropriate levels of risk and volatility, overweighting cash, and something like this happening has been part of the reason why. Hiking cycles cause stresses, every time; and this is why we want to remain conservatively positioned as we weather this economic and market period.
That said, we do not think the volatility of the last week is a bearish gamechanger. Yes, it will increase volatility. Yes, we may see a 10% pullback in the coming weeks. But the medium- and long-term outlooks are not materially more negative now than they were two weeks ago.
Going forward, we will be watching for any further signs of contagion in markets, and if they appear we will take selling action loudly and clearly to “Get out!” For now, this appears to us more of a targeted risk for regional banks and an earnings headwind for financials more broadly, but not a systemic issue that requires abandoning long-term financial goals for preserving capital.
Economic Data
What You Need to Know in Plain English
CPI Preview: The Good, Bad and Ugly
Disinflation stalled in February (and in some cases reversed) and stocks and bonds dropped as a result, because inflation remains much, much too high for the Fed to pivot to a less-hawkish stance. So, for stocks (and bonds) to rally, we must see disinflation reengage, and the sooner the better.
- “Good” Core CPI: < 5.5%. A 50-bps hike in March becomes unlikely. Markets want to see disinflation resume, which is a decline in the rate of inflation. So, since Core CPI rose 5.5% y/y in last month’s reading, markets will welcome any drop below that level to imply that disinflation has resumed, and the bigger the drop, the better. Likely Market Reaction: The turmoil in banks notwithstanding, a drop in CPI should create a solid rally in stocks led by tech and growth while bonds should also rally hard. The dollar should drop moderately while yields should fall, led by a larger drop in the 2-year Treasury yield. This is the best-case scenario for stocks as it implies, after a brief pause, disinflation is re-engaging.
- “Bad” CPI: 5.5%. A 50-bps hike is very possible. If Core CPI doesn’t decline from last month that will be further evidence that disinflation has stalled, and while this number should not create a massive selloff, it would likely weigh on stocks and bonds. We would expect broad weakness (but not intense selling) with defensive sectors relatively outperforming. Treasury yields would likely rise following last week’s late decline, led by the 2-year yield as it would keep a 50-bps hike possible. The Dollar Index should rally modestly.
- “Ugly” Core CPI: > 5.6%. 50-bps becomes very likely. This number would further imply that disinflation has not just stalled, it has reversed, and the market reaction would be ugly. We would expect steep drops in stocks led by tech/growth/financials while defensives should relatively outperform but still decline. Treasury yields should spike as a 50-bps hike becomes fully priced in, with the 2-year yield rising more quickly than the 10-year yield. The Dollar Index should surge, possibly trading to, and through, 106. It shouldn’t surprise anyone if the S&P 500 turns negative for 2023 on this result.
Commodities, Currencies & Bonds
Gold
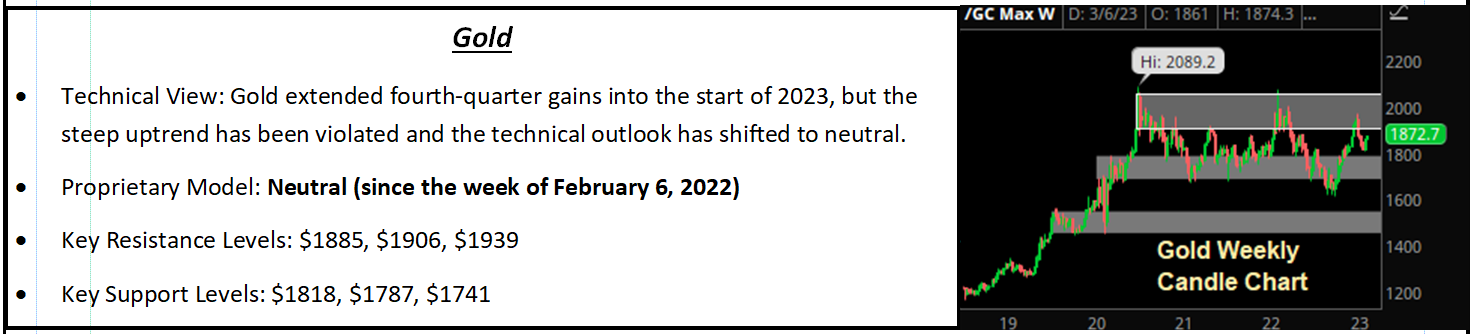
Risk-off money flows dominated commodity markets last week as the combination of a hawkish reaction to Powell’s Congressional testimony and contagion fears linked to the collapse of SVB weighed heavily on industrially sensitive commodities while gold rallied on safe-haven money flows.
Oil began to decline in earnest on Tuesday as Fed Chair Powell was more hawkish than expected during the first day of his Congressional testimony. The prospect of a 50-bps hike at this month’s FOMC meeting and a terminal rate closer to 6% than 5% weighed heavily on the outlook for consumer demand for refined products as recession worries soared given the increasingly aggressive policy stance.
Oil continued lower on the back of the EIA report, which showed fading gasoline demand before risk-off money flows linked to the SVB collapse further pressured oil prices. WTI rebounded on Friday as rates markets priced in a less-aggressive Fed given the SVB debacle but futures still ended down 3.97% on the week. Looking ahead, WTI is still very well contained within its 2023 trading range between $73 and $82/barrel, but on a longer time frame risks remain skewed to the downside given the likelihood of a recession midyear.
Copper also declined last week as China’s government growth outlook disappointed versus expectations while hawkish money flows through Powell’s testimony weighed on global growth prospects. The collapse of SVB weighed on risk assets into the end of the week, which further dragged copper lower with futures ending the week down 1.57%. Copper futures are also in a trading range right now, pinned between support at $3.95 and resistance at $4.30; however, as is the case with oil, risks are to the downside for copper due to the negative impact of a looming recession.
Gold bucked the bearish trend last week as Treasuries caught a fear bid and the dollar pulled back on less-hawkish money flows in the back half of the week. Gold futures gained 0.53% to close at a fresh one-month high. Last week’s shift in cross-asset money flows, specifically the drop in the dollar and rise in Treasuries, could be a bullish gamechanger for gold if the trends persist; however, that remains a big “if” right now.
Oil Market Update
EIA Data and Oil Market Update
Factoring in all of the various influences on the oil market right now, risks remain skewed to the downside due to the elephant in the room, i.e. the threat of recession. With global supply dynamics as steady as they can be in an environment where the world’s previously largest exporter of oil and refined products remains in an active war, demand uncertainties are keeping a lid on prices here. While certain supply side headlines or catalysts have the potential to send WTI through current resistance at $82 and towards $90, we maintain the view that the more likely scenario is a decline into the $60 range for WTI by year end.
Special Reports and Editorial
What Powell’s Comments Mean for Markets
The Fed chair gave markets their first hawkish surprise of 2023, and for what seems like the third or fourth time in a year, Powell basically contradicted his own prior commentary when he stated rates will rise more than previously expected and a 50-bps increase in March is firmly on the table. Stocks and bonds dropped as a result.
Throughout 2022, hawkish surprises from Powell and Fed officials were followed by extended selloffs in stocks and bonds in April, June, September, and December. So, it is reasonable to wonder if the hawkish surprise will cause a similar drop. For now, we do not think Powell’s comments will cause a material and sustained selloff (something between 5%-10% in the S&P 500), although a give back of the entire YTD gains in the S&P shouldn’t shock anyone.
The reason we do not think Powell’s comments represent a new, additional headwind is simply because Powell confirmed what the bond market has already priced in, i.e. a terminal fed funds rate of around 5.625% and a solid chance of a 50-bps hike at the March FOMC decision. Remember, since the January jobs report on Feb. 6, bond yields have surged higher, with the 2-year yield rising nearly 100 basis points and the 10-year yield rising sharply as well. In essence, the hotter-than-expected inflation and growth data forced bond markets to price in what Powell acknowledged: Disinflation has paused and growth remains strong, and that will force the Fed to hike more, although not a substantial amount more.
Going forward, there are two events that could cause new headwinds on stocks and cause a 2022-like 5%-10% pullback in stocks. First, the Fed signals it will raise rates substantially above the current 5.625% estimate. For practical purposes, our investment team believes that means 6.00% or higher. If the Fed signals that is where fed funds are going, that will push bond yields sharply higher, further invert the yield curve, and hit stocks, likely hard (perhaps a test of the 2022 lows).
Second, growth rolls over. Strong economic growth is the fulcrum holding this market up right now, because stocks can stomach higher rates as long as growth is strong (the “No Landing” scenario). However, with disinflation paused for now, any sudden and sharp drop in economic activity will evoke stagflation concerns, and this market is absolutely not priced for stagflation at all (that would likely result in a break of the 2022 lows).
For now, neither one of those two events is happening, and the net result of Powell’s comments last week was to push the S&P 500 back into what we consider “fair value” based on our February Market Multiple Table (Red, Yellow, Green Light).
Bottom line, yet again, the market has prematurely priced in a Fed pivot/pause, and that is once again proven to be false. For now, all that has done is reverse most of the YTD gains that came on the hope of a near-term pause. Going forward, this last month in the markets underscores the point we made at the beginning of the year: The data is more important than the Fed in 2023.
The data showed disinflation in February, and the bond markets pushed yields higher as a result. Only after that was done did the Fed acknowledge more rate hikes were coming. Going forward, we must focus on the data, and that includes the looming CPI report Tuesday.
Fed Pause Playbook
The market and investors have widely adopted the idea that a pause in rate hikes will be a positive catalyst for markets. Yet despite that near-unanimous belief, the facts imply the outlook for stocks once the Fed pauses is not nearly as positive as the consensus might think.
Last week we spent time reviewing the performance of the market and sectors following rate hikes, and the conclusions challenge the idea that the Fed pausing will be a bullish catalyst for markets. It might end up being just that, but it also might be a decidedly bearish catalyst.
For our analysis we researched broad market, specific sector and factor performance following the date of the Fed’s last rate hike of a cycle: May 2000, June 2006 and December 2018. We then looked at the performance over six, 12, and 24 months from those dates to determine 1) If markets broadly and consistently rallied following a Fed pause, 2) If there was clear cut sector outperformance in the time frames following the rate cuts, and 3) If rate cuts benefitted growth over value. Finally, we identified a sector and factor “Playbook” of where to allocate following the actual Fed pause (based on historical performance). Here are our conclusions.
- Is a Fed pause good for markets? Answer: Not usually (although it can happen). Most major indices and sectors were solidly lower in the two-to-three years following the Fed rate pauses of May 2000 and June 2006 (some indices were still positive two years after the May ‘06 pause, but a few months later the financial crisis had taken hold and most sectors were sharply lower). Only the rate hike cycle of 2018 saw solid gains across markets and sectors following a rate hike pause (that was looking like a successful economic soft landing until the pandemic). So, while it’s possible a Fed rate hike pause can be a positive longer-term catalyst for markets, it all depends on growth (i.e. whether the Fed can stick a soft landing) and the data there is decidedly mixed, and in no way does it imply that a Fed pause is an automatic catalyst to buy.
- That statement is especially true if we consider the macroeconomic reality of the moment, as it looks a lot more like ‘00 or ‘06 (higher inflation, strong consumer, Fed trying to slow the economy and inflation) than it does ‘18 (where the Fed gradually raised rates over a three-year period).
- There is a clear cut best performing sector following Fed rate pauses, but it is likely not the one you think. There is only one S&P 500 sector that registered a positive return following the last three rate hike pauses (‘00, ‘06 ‘18) and it was Consumer Staples (XLP). Its average return for the 6-, 12- and 24- months following rate hike pauses over those three periods was 8.5%, 16% and 21%, respectively! So, based on history, we would expect that sector to outperform once again following a pause.
- Past performance following Fed pause strongly advocates for defensive sector and value exposure. Only three sectors were higher six and 12 months after a Fed rate hike pause across all three periods: Consumer Staples, Utilities and Financials. This data is why we continue to prefer overweighting our Large Cap Value portfolio over Large Cap Growth and small caps over large.
- The tech sector performance is negatively skewed by the tech bubble bursting in the early 2000s, but even if we ignore that time frame the tech sector largely traded in the middle of the pack following the ‘06 rate hikes and moderately outperformed after the ‘18 rate hike. Point being, as long as there’s not a tech bubble bursting, the Fed pausing rate hikes isn’t a specific negative for tech, but it doesn’t create massive and consistent outperformance either (which means one shouldn’t avoid tech altogether, but shouldn’t aggressively overweight it, either).
The financial media and investors have grabbed into the idea that when the Fed pauses rate hikes it will be a positive catalyst for stocks. However, the history of the last three rate hike pauses is clear: The market performance post pause is decidedly mixed (if not skewing negative).
Additionally, while two of the past three rate hike pauses have produced solidly positive returns over 6- and 12-month periods, the S&P 500 was still down two years after the ‘00 rate hike pause and the ‘06 rate hike pause.
Bottom line, we hope the Fed sticks a soft landing, and hope past performance post Fed rate hike pauses isn’t foreshadowing something coming in the future. But we must respect the past and that is why we brought up this data—caution is still warranted.
By Vann Equity Management