

Highlights
Key Takeaways
- Less Bad Isn’t Good (Especially at these Valuations)
- Oil Market Update
- Special Reports and Editorial:
- Current Fed Expectations
- More Signs of Dis-Inflation
- Was Powell’s Speech that Bullish? No.
- Weekly Market Preview: Can the S&P 500 Hold Recent Gains?
- Weekly Economic Cheat Sheet: More Signs of Dis-Inflation This Week?
Stocks
Stocks rallied last week and the S&P 500 briefly hit 4,100 for the first time in several months, and while Friday’s jobs report was clearly “Too Hot” the bottom line is a lot of positive events occurred last week:
- Powell wasn’t as hawkish as feared
- Expectations for the terminal rate drifted slightly below 5%
- More signs of disinflation occurred in the U.S. (ISM Prices) and globally
- The Dollar Index dropped (which is good for earnings) and Treasury yields fell (boosting multiples)
While these catalysts aided the rally that started in early November, following the drop in CPI, it is important not to confuse “less bad” conditions with actual “good” ones! As of Friday, December 2, 2022, the S&P 500 closed above 4,000 and the truth is that the valuation of this market is now at the limit of, or exceeding, what the facts imply.
Here is Our Take on Why: While estimates for earnings on S&P 500 for 2023 are in a bit of fluctuation (specifically how much should they fall), $225 seems like a fair middle ground between the $235 optimists and the $215 (or lower) pessimists. At those earnings, the S&P 500 is trading at an 18X multiple. Certainly, the recent disinflation and decline in yields (Treasury yields are 20 bps off the highs) do provide a boost to the market multiple up from the 16X-ish level at the lows. However, this modest decline in yields does not justify these valuations. Meanwhile, the outlook for future growth has deteriorated, which adds extra downside pressure to the market multiple (remember, a “typical” recession valuation is around 15X).
S&P 500
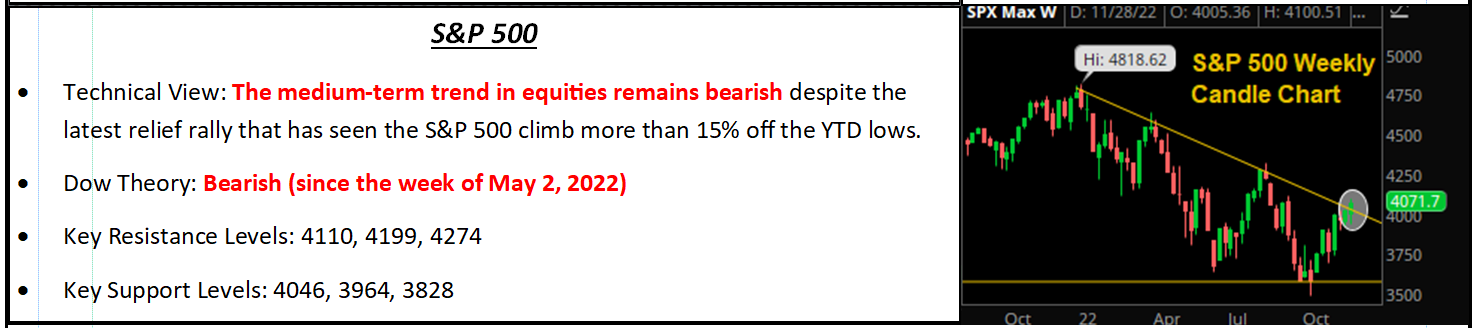
Over the past three weeks, the macro environment has become “less bad” and that does justify some rally. But our Investment Committee does not want anyone to confuse year-end seasonals and positioning, combined with a sudden burst of optimism, to imply the last few weeks have sown the seeds for a sustainable rally and an end to this volatility. Because we believe they have not.
The reasons are clear: The Fed is still hiking rates and there are real headwinds on the U.S. economy and the Fed pivot remains (still) a long way off. So even if the Fed stops hiking after the December or February meeting, the headwinds on growth will still be substantial. Meanwhile, economic growth is rolling over and corporate earnings are under pressure. We appreciate that this initial bout of disinflation and drop in yields has elicited a Pavlovian response to rally stocks; but let our positioning be clear: A stagnant economy and falling earnings do not create a good environment for stocks.
That really is the key of our focus as we enter 2023. The Fed will stop hiking rates, and when that happens it will eliminate a negative, which is a good! But, the immediate question then becomes, “How bad is the economy?” The yield curve, which we listen to, says the answer will be “bad” and as such we continue to worry that the initial swell of optimism as inflation fades will be replaced by a difficult reality of 1) No growth (or economic contraction) and 2) Falling earnings, and that will keep returns challenged until the Fed signals it is ready to support the economy again (hopefully sometime in ‘23, but possibly ‘24).
Finally, it is important to be aware of periods in the market of falling earnings where stocks looked past the weakness and managed positive returns, most recently around 2016; but we see that there is a big difference between that period and this one; which is… The Fed. Back then, the Fed was solely focused on supporting the economy, so it provided a proverbial “net” investors could rely on to catch the markets. Now, the opposite is true.
Bottom line, we are not not trying to be over pessimistic. Good things have happened in the markets over the past few weeks. But they have also been very aggressively priced in at these levels, and we are still facing major headwinds for risk assets including rising rates, slowing growth, high inflation and falling earnings. That is simply not an environment we want to be aggressively invested in, especially with equities, and amidst this sudden boost in optimism, we will stay focused on those facts. This is why we have raised cash in all of our model portfolio’s and continue to sit and wait…. And we cannot wait for them to change, and to say loudly and joyously, “The coast is clearing.” But we are not there yet.
Economic Data
What You Need to Know in Plain English
Economically speaking, last month was going well for both stocks and bonds as data showed slowing growth and evidence of disinflation, at least until Friday’s jobs report, which met our “Too Hot” scenario analysis and caused a sharp drop in stocks.
Starting with the jobs report, because it was the most important report last week, as mentioned it was “Too Hot” on most metrics (especially wages). To that point, while there was focus on the headline reading being above estimates (263k vs. (E) 200k), the most important number in the report was the wage data, as wages rose 0.6% vs. 0.3% m/m, 5.1% vs. (E) 4.6% y/y and October wages were revised massively higher to 5.6% y/y from the initial 4.7% reading.
In our analysis of Powell’s speech, the Fed Chairman specifically singled out the tight labor market and high wages as sticking points on inflation, meaning the Fed can’t be confident inflation is truly falling until they see declines in those metrics. Well, we are not seeing declines in those metrics and as such Friday’s jobs report resulted in a reversal of part of the most recent stock and bond rally (which was based on the idea of the Fed being less hawkish than feared and signs of disinflation and slowing growth).
Looking at the rest of the month-end data, it was generally positive as it showed moderating growth and disinflation. Starting with the ISM Manufacturing PMI, it dropped into contraction territory (49.0 vs. (E 49.9) while New Orders dropped to 47.2 and Prices fell 3.6 points to 43.0. That implies slowing growth and falling prices, something markets want to see. Globally, we also saw signs of disinflation, as Eurozone CPI, PPI, German CPI and Spanish CPI all rose less than expected (or fell more than expected on a monthly basis) implying that disinflation in goods and some services is starting to take hold globally (this is good medium/longer-term but it won’t help markets near term).
Bottom line, it is becoming clear that 1) Economic growth is slowing as the impact of higher rates moves through the economy and 2) Inflation has likely peaked and disinflation is taking hold. But until we see real, tangible progress that the labor market is moving into better labor supply/labor demand balance, it’ll be very hard for the Fed to even think about a pivot.
Commodities, Currencies & Bonds
Commodities were mixed last week as oil broke down on renewed growth concerns weighing on the demand outlook while the mentals were little changed amid fading inflation expectations and economic uncertainties.
WTI crude oil turned negative for the year (again) thanks to the negative headlines about protests in China and potentially stricter lockdowns in the works as a result, which would clearly delay the reopening process for the world’s largest crude importer. Additionally, over the weekend, OPEC+ agreed to hold steady on their collective production target as they assess the impact of the G7’s price cap on Russian crude oil exports. OPEC+ also announced they will not meet again until June unless there is a material market development that warrants a change in policy.
Looking ahead, that will leave the market focused on the demand side with concerns about China’s Covid policies and the health of the broader global economy being the main drivers of prices. WTI remains rangebound between $76 and $93/barrel.
In Treasuries, yields fell last week, but like the dollar, the losses were reduced thanks to Friday’s jobs report. The 2-year yield fell 11 basis points, while the 10-year yield fell 7 basis points. The reasons for the declines were the same as the dollar drop: Powell was not as hawkish as expected, underwhelming economic data and growing evidence of global disinflation. The 10s-2s spread remained in deeply negative territory at -76 bps, as the rally in yields did nothing to stop the yield curve from screaming that a material economic slowdown is coming in the next several months or quarters.
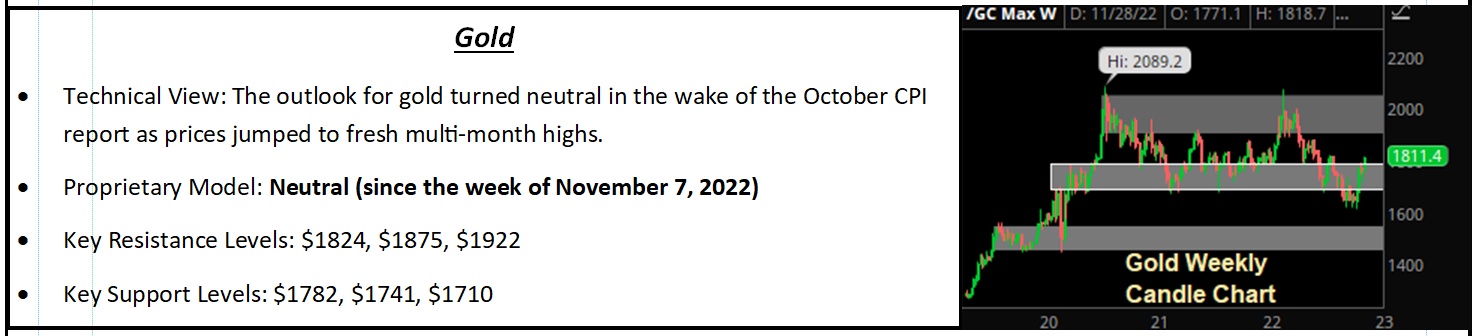
Gold
Oil Market Update
EIA Data and Oil Market Update
Downbeat domestic economic data and uncertainties about the path forward for the Chinese economy given their still-strict Covid policies weighed heavily on oil prices in the latter part of November. But so far, WTI has held on to key support at $76/barrel leaving the market rangebound with resistance at $93/barrel.
Looking ahead, OPEC+ data will come into focus this weekend as the group is set to hold their December policy meeting virtually. The consensus opinion is for no change to the collective production target; however, the risk is that they cut output by 500K b/d, which would be bullish. Beyond OPEC+, focus will be on economic data into year-end as hopes for a soft landing could further bolster WTI prices back for a test of recent highs in the low $90s, while renewed worries of a potentially deep and lengthy recession could send oil futures to new 52-week lows.
Special Reports and Editorial
Current Fed Expectations
In early November, the softer-than-expected CPI rekindled hopes of a less-hawkish Fed and that hope has largely underwritten this multi-week rally. In contradiction to that hope, over the past few weeks Fed rhetoric has pushed back against that idea and that continued Monday with a trifecta of Fed officials stating more rate hikes are coming.
First, Mester told the FT early Monday that a Fed pause wasn’t close. Then, at midday, uber-hawk Bullard repeated his call for fed funds between 5%-7%, reminding markets of the potential extent of Fed rate hikes. Finally, in slightly more mixed commentary, the Fed’s Williams stated that there had been some progress on inflation, but there was more work to do and higher rates were needed to restore the supply/demand balance.
None of these comments were revolutionary or materially more hawkish than expected. They did, however, continue to push back against the market’s remarkably consistent desire to price in a greater probability of a Fed pivot based on a few signs that disinflation was starting to creep into the economy.
As we approach the December rate hike (and beyond), “noise” surrounding Fed policy will only get louder and the true market impact more difficult to identify. So, I wanted to provide an update on current bond market expectations for fed funds, because it will take a material departure from these expectations to drive a sustainable rally in stocks (if the Fed moves dovishly) or decline (if the Fed gets more hawkish).
To help keep focus on the facts (and not the rhetoric) our Investment Committee has provided an update of 1) Current Fed Rate hikes expectations and 2) Possible other outcomes, and what they would mean for markets.
Current Fed Funds: 3.875%. Current December Fed Funds Rate Expectation: 4.375% (a 50-bps rate hike). Confidence: High (68% probability). A 50-bps rate hike will cap a historic year of Fed rate hikes, as the FOMC will have gone from 0% in early March to over 4% in just nine months. That dramatic increase in rate hikes is why the Fed is slowing the pace of rate hikes moving forward — not because it’s more confident inflation is dropping rapidly, and that’s an important difference to keep in mind. A Fed pivot won’t come until the Fed is convinced inflation will fall towards its 2% target, and we are not close to that point.
Current February Fed Funds Rate Expectation: 4.875% (another 50-bps hike). Confidence: Not high (51.9% probability). Next most likely outcome: 4.625% (a 25-bps hike). Markets are torn about the February rate hike simply because there is a lot of time between the December hike (on Dec. 13) and the February hike (Feb. 1) and during that time we may see material deterioration in 1) Economic data and 2) Substantial declines in CPI and the Core PCE Price Index. If either occur, then a 25-bps hike in February will become more likely and the market will embrace that as getting us close to the Fed pivot (and this time rightly so). Conversely, if we see the expectation for a 50-bps hike rise above the current 51%, that will be an incremental negative and hit stocks and bonds, as it’ll reflect a more-hawkish-than-expected Fed.
Current March (and Terminal) Fed Funds Rate Expectation: Basically a split between 4.875% (so no hikes after February) and 5.125% (an additional 25 bps rate hike in March). Confidence: Very Low. Each outcome (4.875% and 5.125%) has a 39% probability. That means this is the key question for markets (and the one with the greatest potential to spur a big rally or decline, depending on the outcome). Does terminal fed funds occur above 5% or under 5%? Right now, markets basically have it at 5% so any expectation of terminal fed funds above 5% will be an incremental negative for markets (no Fed pivot) while any confirmation of terminal fed funds below 5% will be a mild positive.
As we begin to look towards 2023, focus of the markets will eventually turn towards the economy and earnings, specifically to learn how much growth will slow and earnings will fall. But before that can occur, the Fed must “finish” its rate hike campaign (and actually pivot), so for now the single biggest influence on stocks remains the Fed and the impending rate hikes.
Understanding the current expectations for Fed rate hikes over the next four months will be critical to understanding whether Fed rhetoric and headlines are positive or negative for markets. As a general rule, anything that makes Fed rate hike expectations higher than the numbers in the above table will be a negative for markets, while anything that causes Fed rate hike expectations to fall below these numbers will be a positive (and get us closer to the Fed pivot). As such, we suggest printing this table/section and keeping it as a reference, especially into the Fed meeting on December 13, because the “dots” will confirm or refute the above expectations, and the market impact could be significant.
More Signs of Disinflation
- German CPI declined -0.5% vs. (E) -0.2% m/m and rose 10.0% vs. (E) 10.4% y/y.
- Spanish CPI rose 6.6% vs. (E) 7.3% y/y.
- September Case-Shiller Home Price Index fell -0.8% vs. (E) -1.2% m/m and rose 10.4% vs. (E) 10.9% y/y.
Tuesday brought more evidence of disinflation, but not from the usual sources, as the case continues to build that inflation has indeed peaked and now is decidedly falling (and that’s a good thing over the medium term).
Starting first with global data, German CPI, which is the second most important EU inflation reading behind the EU HICP, declined more than expected in November and that resulted in the year-over-year reading falling to 10.0%, solidly below the 10.4% in October. In Spain, their annual CPI declined to 6.6% y/y, solidly lower than the previous 7.3% (Spain hasn’t been as impacted by surging energy costs as Germany has, so their inflation has been less severe).
Normally German or Spanish CPI wouldn’t be that impactful, but these are not normal times and these numbers matter for a simple reason: Inflation has been a global phenomenon, so if evidence builds that it has peaked globally, that will make central banks more confident that, collectively, their rate hike regimen is working. Here’s why this matters.
The Fed will pivot long before CPI gets to 2%. At what point of CPI the Fed pivot will depend on how confident it is that inflation is trending decidedly lower. Global disinflation will make the Fed more confident earlier than if just U.S. CPI stats are falling. So, falling inflation stats globally are a general positive for all risk assets (including U.S. stocks and bonds).
Turning to Case-Shiller, in testament to how skewed inflation stats are right now, in any other times a -0.8% monthly decline in Case-Shiller would be considered a home price implosion, but now it’s merely another step in the right direction. Case-Shiller usually isn’t discussed in the context of inflation, but these are extraordinary times.
The reason this is important is because housing makes up 40% of CPI. One of the main reasons CPI is still so high is because of the lag effects of the housing price ramp up. Once these housing price declines start to work their way into the CPI, the decline in the monthly readings will accelerate and that will bring us even closer to the pivot the market needs from the Fed. Bottom line, more often than not housing price declines are a negative for the economy, but the positive impact on CPI outweighs, for now, the negative implications of home price declines.
Bottom line, the fastest way to a Fed pivot is via quick and widespread disinflation, not just in the U.S., but globally. These statistics will only further reinforce the idea that inflation has peaked, and while it’s still much, much too high for a pivot anytime soon, the more evidence of disinflation the sooner the pivot comes, and that’s why the German and Spanish CPIs and Case-Shiller were positives.
Were Powell’s Comments That Positive? No. Here’s Why
Fed Chair Powell’s speech sparked a significant rally Wednesday afternoon thanks to a speech that was less hawkish than feared. But despite the big rally Powell didn’t alter the Fed’s position on rate hikes and didn’t bring us any closer to a pivot. As such, we don’t see the comments as a material bullish catalyst.
First, it’s true Powell was less hawkish than feared yesterday. Markets expected Powell to basically repeat his last speech, where he warned markets were underestimating the terminal rate and again stressed the Fed was nowhere near a pivot.
Instead, Powell stated that rates would have to rise “somewhat” higher than the September projection. The terminal median dot in September was 4.625%, and “somewhat higher” was taken by markets to mean “not very much higher.” As such, Powell seemed to imply terminal fed funds won’t rise above 5% and may well be under 5% at 4.875%. Additionally, Powell essentially told markets directly that the Fed will hike 50 bps in December, compared to leaving the size of the rate hike less certain, as he did in his last speech.
So, why weren’t these two changes, which are less hawkish than feared, sustainable positive catalysts?
First, Powell’s comments were “less hawkish than feared,” not “less hawkish.” Markets had braced for Powell to repeat the brow beating of the past several speeches and that’s why stocks were lower into the speech. When that didn’t happen, it caused a knee-jerk chasing that saw stocks rally into the afternoon. The truth is much of that reaction was because markets expected more negative commentary, and the surprise caused a sharp rally.
Second, Powell wasn’t really less hawkish. While it’s true the phrase “somewhat higher” implies terminal fed funds won’t be much higher than 4.625%, Powell quickly hedged that by stating it is becoming apparent rates may stay at that level for longer than expected.
That essentially means that the Fed pivot may be farther off than expected, although rates may not go as high as feared. That’s not a materially positive catalyst, unfortunately, and while we certainty enjoyed the rally, we want to stress loudly and clearly that Powell was not less hawkish and we are not any closer to a Fed pivot.
Signs of Falling Inflation and Falling Growth Are Growing
Stocks largely held Wednesday’s gains as markets benefitted from a “bad data is good for stocks” mentality. Specifically, the Challenger job cuts data exploded higher to 76,835 from 33,843, the ISM Manufacturing PMI dropped solidly into contraction territory and the Core PCE Price Index wasn’t as high as feared on a monthly basis.
Those data points helped send bond yields and the dollar sharply lower, which, for yesterday at least, investors and traders viewed as virtuous as it boosts multiples and earnings. That leads to a key question that we will address more fully: How long can “bad data is good for stocks” last?
Historically speaking, it hasn’t been for very long, and we will dive deeper into that because we firmly believe the transition from Fed tightening as the main influence on stocks in 2022 to “how bad” growth and earnings will be in 2023 is the key macro issue as we start the new year, and we are focused on making sure we are prepared for that switch.
By Vann Equity Management