

Highlights
Key Takeaways
- Weekly Market Preview: Why Too Hot & Too Cold Data is Negative for Markets
- Weekly Economic Cheat Sheet: Flash PMIs and Core PCE the Key Reports This Week
- Oil Market Update
- Special Reports and Editorial:
- Dow Theory Update: Bullish Reversal in July
- What the Fed Decision Means for Markets
Stocks
✓ What’s Outperforming: Growth factors, tech consumer discretionary and communication services, the worst performers in 2022, have outperformed YTD. However, higher yields remain a headwind and as such we do not think this outperformance will last over the longer term.
✓ What’s underperforming: Defensive sectors and value have underperformed YTD but are still massively outperforming since the bear market started in 2022, and since our primary concern in 2023 is economic growth, we think this underperformance will be temporary.
S&P 500
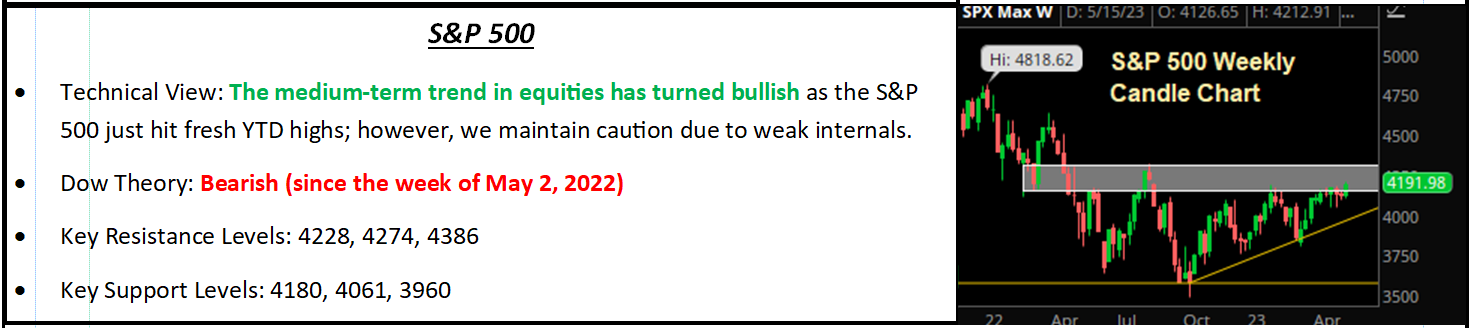
Why Too Hot & Too Cold Data is Negative for Markets
Unlike the January-through-May advance in the S&P 500, the rally since June has not been driven primarily by bearish sentiment or the impact of seven stocks on the S&P 500 (while the other 493 did nothing). Instead, the rally since June has been quite logical: Solid growth, falling inflation, and looming end of Fed rate hikes. We call these the “Three Pillars” of the rally: Soft/No Landing, Disinflation, and Fed Done (or Almost Done) with Rate Hikes, and as long as these pillars stay in place and are confirmed by the economic data, the outlook for stocks is positive near-term.
Logically, then, it is going to take actual news to break that positive mantra and cause a real pullback in this market, and that did not happen last week (so stocks drifted slightly higher). So, our focus from a risk management standpoint is to identify, as early as possible, any events that could damage those three pillars. Just like economic data has driven this rally since June, data that’s “Too Hot or Too Cold” can also undermine or end this rally, and we want to explain that here.
Generally, if economic data is Too Hot (meaning too strong) then that damages two of Three Pillars: 1) Disinflation and 2) Looming end of Fed rate hikes. That is because a strong economy 1) Puts upward pressure on inflation and that will cause the Fed to 2) Reconsider hiking rates more. Further, that is why stocks dropped Thursday following the decline in jobless claims. As we look ahead, this week we will be monitoring ISM Manufacturing and Service PMIs, Jobless Claims, Wages, and the Unemployment Rate in the jobs report. If any of those are “Too Hot” it will be a headwind on stocks.
Conversely, and generally speaking, if economic data is “Too Cold” (meaning much weaker than expected) that damages one pillar of the rally: Soft/No Landing. Of the Three Pillars, that is the most important one, because if data suddenly drops off (and this is our main concern as we move into the end of the year) then 1) Valuations in stocks are much, much too high and 2) The Fed has raised rates too high, and they will never be able to cut fast enough to forestall a recession and 3) Earnings will drop. This is the No. 1 candidate to reignite a bear market (and the complacency of markets around this risk is vulnerability, in our opinion, not near term, but in the coming quarters).
Bottom line, we and others said at the start of the year that economic data would drive this market in 2023, and that is what has happened. The data has been Goldilocks, inflation has fallen, and the Fed isn’t worse than feared; but just like those were positive surprises YTD, they can also turn into negative surprises, as anyone who was in this business in ‘99-‘00 and ‘07-‘08 can tell you.
For now, the outlook for stocks remains positive and we continue to think cyclicals, small caps, and Value can continue to close the performance gap with tech. It is important to remember that this is not a serendipitous rally—it has been driven by data, and if the data turns more negative, there is nothing to support stocks, especially at these valuations. That is why we will continue to closely watch the data.
Economic Data
What You Need to Know in Plain English
For the past two weeks, economic data has been Goldilocks enough to support the rally in stocks, and that largely continued last week as data was mostly solid (in some cases slightly too good) while the Fed decision met expectations, last week’s hike is likely the last one.
Starting with the Fed, it met expectations and hiked rates an additional 25 bps and made no change to forward guidance, leaving the door open to another hike between now and year-end, possibly at the September rate hike. However, Fed Chair Powell also was clear that it is possible this hike was the last one, and for a market that does not believe the Fed will hike again, that was enough. Going forward, the market does assume the Fed is done with hikes, so anything that counters that and implies another hike is coming will be a new negative.
Turning to last week’s data, the most important reports came Friday, via the Core PCE Price Index and the Employment Cost Index, two of the more important inflation indicators we receive. They showed what the market expected: More disinflation. The Core PCE Price Index fell to 4.1% y/y vs. (E) 4.2% y/y, down from 4.6% y/y. The Employment Cost Index, meanwhile, rose 1.0% vs. (E) 1.1%. Neither of these data points were revolutionary, but they did further confirm that inflation pressures are easing, and that reinforced the market’s expectation that the Fed is now done with rate hikes.
Looking at growth data, it was mixed but generally stable. The July Flash Composite PMIs were “ok” as the manufacturing PMI rose slightly to 49.0 from 46.0, an improvement but still signaling contraction. The Flash Services PMI, meanwhile, declined to 52.4 vs. (E) 54.0. That is still a solid number, but the service sector is the engine of growth for the U.S. economy, so if we see a loss of momentum there, it will challenge the Soft/No landing thesis. To be clear, that isn’t happening now, but it is something we need to watch.
Finally, the one number that was Too Hot last week was weekly jobless claims, which fell to 221k vs. (E) 235k. That’s a bit Too Hot and the claims reading pushed yields higher on Thursday and weighed on stocks, because if claims stay that low (and unemployment remains low) then another rate hike in September may be more likely than markets think (that’s a possible near-term headwind).
Important Economic Data This Week
Goldilocks economic data has powered the S&P 500 to current levels since June, and it is going to take more Goldilocks economic data to sustain this rally and possibly prime for an extension of it in the coming weeks and months, so this week will be important because we get the “Big Three” monthly economic reports: Jobs Report, ISM Manufacturing PMI, and ISM Services PMI.
We know from Thursday’s reversal in stocks that a spike in Treasury yields is now a negative for stocks (as well as bond prices). The key here is the data doesn’t come in Too Hot and make another rate hike more likely. Additionally, the unemployment rate and wage data will remain very important, as investor expectations for a rate cut in 2024 also support stocks at current levels, and for that to happen we will need to see some drift higher in the unemployment rate and a continued decline in wages.
Notably, Friday’s jobs report is not the only important labor market indicator this week. JOLTS are released on Tuesday and markets will want to see that number continue to trend lower (below 9 million would be substantial improvement and positive for assets) while weekly jobless claims on Thursday will be on focus and the sooner they increase, the better. A number below 220k will put upside pressure on Treasury yields, which will be a headwind on stocks (again as we saw last week).
Next in importance this week is Tuesday’s ISM Manufacturing PMI and Thursday’s ISM Services PMI. Last week, the July flash PMIs were a bit underwhelming, hinting at a loss of momentum in the service part of the economy, while manufacturing saw improvement but remains in contraction territory. Put simply, the Service PMI needs to remain stable, because if the Service PMI drops close to 50 (expectation is for 57.2) that will send an unpleasant reminder that a hard landing is still possible, even though investors have largely dismissed it. That will be a negative surprise for stocks. Meanwhile, the ISM Manufacturing PMI remains in contraction territory but any further deterioration will anecdotally increase hard landing concerns, while a pop back towards (or ideally above) 50 will embolden the Soft/No Landing camp.
Bottom line, the S&P 500 needs Goldilocks economic data to hold current levels, because markets are not at all pricing in a chance for a hard landing, nor are they pricing in another rate hike. Data that makes either more likely will be negative, given current valuations.
Special Reports and Editorial
Dow Theory Update: Bullish Reversal in July
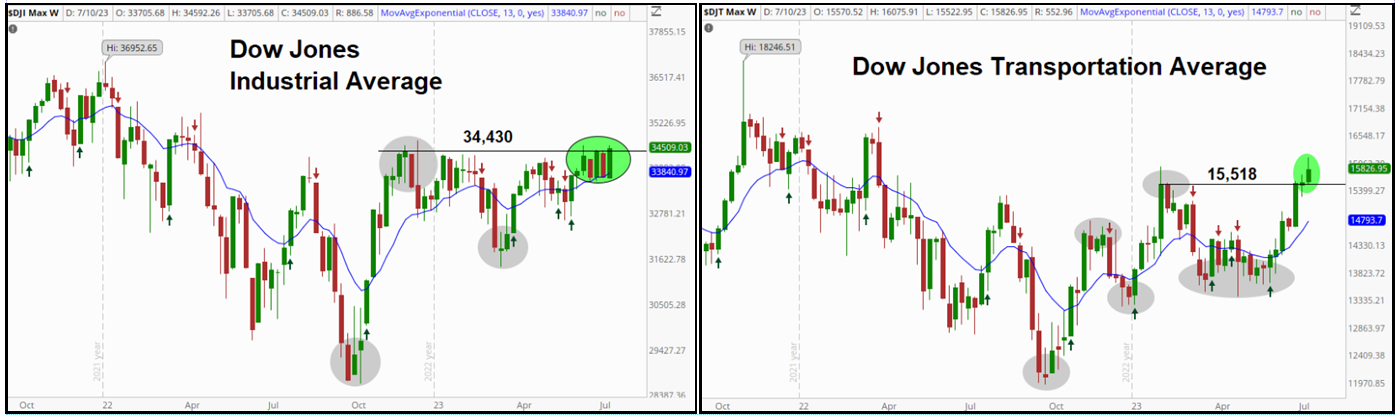
Several emails have come in over the last two weeks regarding Dow Theory as both the Industrials (DJI) and Transports (DJT) have rallied to respective 52-week highs. So we wanted to provide an update on the bullish reversal in the investment strategy that has occurred this month.
Dow Theory, as we monitor it on a weekly time frame, is meant to offer a long-term view of the primary trend in the broader equity markets and signals typically last for quarters or years with investors often waiting for some condition such as a certain mean reversion to be met before adjusting equity allocations. Beginning with a quick refresher, Dow Theory is an investing method that Charles Dow came up with in the late 1800s. While Dow was a market technician, he knew and respected the importance of market and economic fundamentals with regard to investing, and he cleverly came up with a way to combine the two into one simple systematic strategy with the goal of identifying the primary trend in the broader market.
The most general way to explain how Dow Theory works is, first, the primary trend is identified in the Dow Jones Industrial Average and the Dow Jones Transports by looking for the combination of higher-highs and higher lows (uptrend) or lower-highs and lower-lows (downtrend). In non-market terms, an uptrend should somewhat resemble a staircase moving from the bottom left corner of the chart to the top right corner while a downtrend should look like a staircase beginning at the top left and moving down towards the bottom right. Once the respective trends of the Industrials and Transports are established, they are compared to one another. If they “match” and are both trending in the same direction, that is the path of least resistance for the broader stock market.
The fundamental aspect of Dow Theory is that the economy can only meaningfully and sustainably grow over a longer time frame if both the industrial sector, and transportation sector (formerly known as the “rail sector”) are rising together. The reasoning behind that is Dow found that when one of those two major sectors began to turn sideways or outright reverse and begin trending lower, an economic contraction or recession was almost always looming.
Dow Theory’s track record is not perfect, but over the long run it has resulted in risk-adjusted outperformance. Most recently, following Dow Theory’s bearish reversal signal in late April/early May 2022 would have helped investors avoid the additional 15% drawdown realized in the S&P 500 from early May to the October lows. Admittedly, Dow Theory was slow to reverse back to a bullish stance in 2023 and 9% upside in the S&P 500 was left on the table from the bearish signal in H1‘22 and this month’s bullish reversal.
Looking at the specifics of the most-recent bullish signal from Dow Theory, the Dow Transports established an uptrend in late January of this year as the average notched a weekly closing high above the November 2022 closing high following a higher low being established at the turn of the year. The uptrend in the Transports was then confirmed by the Industrials when the average notched a higher closing high on the weekly chart in the second week of July, above the early December closing high of 34,430. Since the incremental new high in the Industrials confirmed the bullish reversal in Dow Theory, both the Dow Averages have enjoyed solid gains, offering further confirmation of the new primary uptrend in equities.
In times like the first half of 2023, where leadership in the equity markets was very thin looking back to the H2‘22 lows that were established, Dow Theory can be skewed and less timely. But with the bullish reversal in Dow Theory this month, we have seen market breadth improve measurably as the Advance-Decline Line jumped to the highest level since January 2022, and the improving participation is yet another bullish technical development we have seen in recent weeks.
Bottom line, Dow Theory turning bullish is not only a positive for the broader equity markets but also a fundamental nod to the health and resilience of the economy in 2023. Looking ahead, the equity rally should have room to run here based on the historical performance of Dow Theory, in spite of still-elevated recession risks based on historical indicators such as the yield curve. If Dow Theory is correct here, we should be on the brink of an additional multi-month rise in the broader market.
What the Fed Decision Means for Markets
Prior to last week’s FOMC decision, the market’s expectation that the Fed is very close to being done with rate hikes was one of the three pillars of the 2023 stock market rally, and following the FOMC decision that pillar remains in place, and that is positive because it further reinforces most of the YTD gains in stocks. More tactically, that means that what we saw in the markets prior to the Fed should continue as long as there are no major surprises in the data, namely: 1) Cyclical sectors closing the performance gap with tech, 2) equal weighted indices outperforming market cap weighted and 3) A general broadening of the stock market rally, where the S&P 500 may churn sideways but laggard sectors such as small caps and value can continue to outperform.
Bottom line, the Fed did nothing to counter the YTD rally in stocks, or damage any of the three pillars currently supporting the rally. At the same time, the Fed did nothing to provide an upside catalyst or to overcome the valuation constraints on the S&P 500 at current levels (reflecting the fact that any material upside is likely tough to achieve).
Looking forward, in the near term (i.e. the next several months) the takeaway from the Fed is to watch the data. The market is not pricing in another Fed rate hike and the market is pricing in a Fed rate cut in early 2024 (March or April). And that is where the risks lie from a Fed standpoint and the economic data will be key in determining whether those risks appear.
Put differently, if the CPI readings between now and the September Fed meeting are hot, or the two jobs reports between now and the Fed meeting are hot, the market will need to price in another rate hike and further price out a rate cut, and that could well become a headwind on stocks in the coming months.
Looking longer term, the FOMC decision keeps alive the real possibility that we do get a future economic slowdown, because if there was one clear takeaway from the FOMC decision, it is that Powell is pushing back on this expectation or a rate cut anytime soon. The longer rates stay high, the greater the chance that they eventually choke off economic growth, or, stated differently, the longer rates stay high the less likely a soft landing becomes, and the more likely a hard landing becomes.
Bottom line, the Fed met expectations and as such the current market set up was not upset, and the near-term outlook for stocks remains generally positive. However, the Fed again signaled higher rates for longer, and the market is ignoring that at its own peril. The reason being is that if rates do stay high for a long time, then markets are underestimating hard landing risks, not necessarily in 2023, but in early to mid-2024.
By Vann Equity Management