

Highlights
Key Takeaways
- Why Stocks Can Bounce Further (But Volatility Isn’t Over)
- Technical Update: Important Support and Resistance Levels to Watch
- Weekly Economic Cheat Sheet: Jobs Report Friday
- What Does the FOMC Decision & Powell Commentary Mean for Markets?
- Why Are TIPS Down YTD If Inflation Is Such a Concern?
- What Could Send 10s-2s Closer to Inversion?
- EIA Data Takeaways and Oil Market Update
Atlanta Fed President Bostic was encouraged by Friday’s inflation data and expected three hikes this year, which is less hawkish than the current market expectation.
China’s manufacturing PMI slightly best estimates at 51.1 vs. (E) 51.0, further implying that economy is stabilizing.
There are no economic reports today, but there are two Fed speakers, Daly (11:30 a.m. ET) and George (12:40 p.m. ET) and if they echo Bostic’s “not as hawkish as expected” commentary from this weekend, then stocks can extend the rally.
On the earnings front, most of the big reports come later this week (FB, GOOGL, AMZN) but after the close today, we get NXPI ($2.98) and markets will be focused on chip availability, and if there’s positive commentary there that could be another tailwind on this market.
Stocks
Last Week (Needed Context as We Start a New Week)
Equity markets remained volatile amid rate hike fears and simmering geopolitical tensions last week, but a late rally Friday saw the major indexes break a three-week losing streak. The S&P edged up 0.77% on the week and now is down 7.01% YTD.
Volatility exploded Monday with the major indexes gapping lower at the open amid ongoing rate hike concerns while the threat of a Russian invasion of Ukraine weighed on risk sentiment broadly. Economically, the Composite PMI Flash badly missed estimates with a notable slowdown in the service sector, compounding worries that the Fed is about to tighten policy into an economic slowdown. A strong 2-Year Treasury auction in the early afternoon helped stabilize markets, however, and the S&P 500 ripped back to close higher by 0.28%.
Tuesday was another volatile session with stocks ending lower thanks to ongoing tensions surrounding Ukraine, a negative revision for global growth by the IMF, and positioning into the Fed. The S&P 500 fell 1.22%.
Stocks rallied Wednesday morning thanks to strong guidance by MSFT and other techs, but those gains were reversed in the afternoon following an initially dovish reaction to the Fed announcement. But later, money flows turned decidedly hawkish after Powell’s presser as the market priced in the possibility of a 50-bps hike in March. Stocks ended down a modest 0.15%.
Stocks gapped higher at the open Thursday as economic data was mostly positive with jobless claims notably declining on the week while investors continued to digest the January Fed meeting. Stocks held morning gains through the European close but then the yield curve began to flatten to new lows which pressured stocks. The S&P 500 fell 0.54%.
Stocks traded with a heavy tone to start Friday despite positive earnings and guidance from AAPL and inflation data that was not as hot as feared (Core PCE was in line and the Employment Cost Index was below expectations). Stocks rallied into the European close but rolled back over in the early afternoon before a late-day rally saw the index surge higher into the close, ending with a sizeable 2.43% gain. AAPL notably rose 7% on the day.
S&P 500
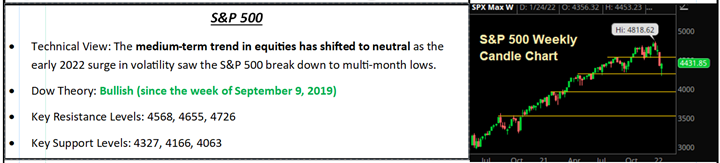
Technicals: Support and Resistance Levels to Watch
Technically speaking, the S&P spent most of last week violently oscillating between roughly 4,300 and 4,450, but Friday’s late-day rally that saw the S&P turn positive for the week was encouraging and suggests that, depending on the market catalysts or news flow to start the week, we could see a continuation higher, and a relief rally carry the index back towards the 4,600 area. It would be a mistake to assume that we will automatically return to new all-time highs and that market volatility is over, however, as Fed policy expectations and rate hike fears have proven to be capable of sending the broader market down by more than the 5% dips we saw in 2021, and periodic corrections are not only possible but could be the new normal. It is also worth noting that Friday’s rally in the S&P 500 stalled at the 200-day moving average and that price level at 4,435 will be the first hurdle the market will need to clear (on a closing basis) to move higher this week. If the market is able to break higher to start the week, look for support between 4,330 and 4,380 in the S&P to hold on a modest pullback, but a breakdown and close at new multi-month lows would open the door to a swift pullback towards 4,000.
Markets Are Due for A Bounce, But Volatility Isn’t Over
Stocks surged Friday and that helped turn the S&P 500 positive for the week, and the reason why was that inflation data (especially the Employment Cost Index) wasn’t as bad as feared—and that offered hope that inflation pressures are peaking.
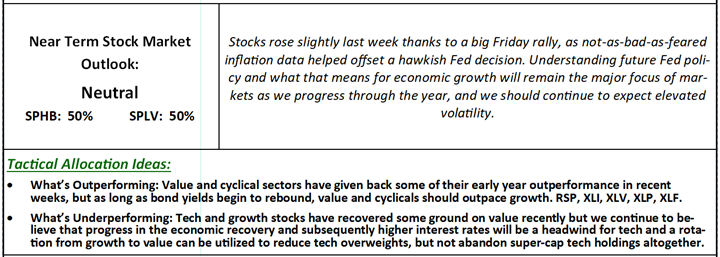
Normally, that wouldn’t cause a 2.4% rally in the S&P 500. But throughout January the market has priced in a very, very hawkish Fed, so much so that there is now room for “dovish” surprises to help stocks rally near term. And, to a point, that’s what we got on Friday. And this relief rally can continue if we get solid earnings this week and more dovish hints (either via the data or Fed speak) towards (and possibly through) the 4,600 target.
But while it’s entirely possible the market got “Too Hawkish” and a mild dovish shift in those expectations could cause a relief rally, the case remains that the Fed is removing accommodation and that will pressure the market multiple. And until there’s Fed clarity, we do not see this market being able to approach the old highs or set new highs.
We’d use any sustainable rally (possibly in the coming days) as an opportunity to 1) Lighten up exposure to high-P/E, high-growth tech names and 2) Reallocate those proceeds to lower-P/E, lower-volatility sectors and ETFs (VTV/USMV/SPLV). Additionally, while we think that last Monday’s lows can hold unless we get another hawkish surprise from the Fed (six hikes?) or a really bad week of earnings, we do not think the volatility is over. So, we’d also use any continued rally as an opportunity to reduce equity exposure so that if/when we revisit those lows, it’s not quite as painful.
Bottom Line
This market is due for a bounce if we get a slight dovish shift in expectations, but volatility isn’t over.
Economic Data
What You Need to Know in Plain English
Need to Know Econ from Last Edition
Economic data was underwhelming last week, the Fed was, again, more hawkish than expected and inflation indicators remained firm but offered some hope of a peak in inflation pressures. Those factors contributed to the still-elevated volatility in markets (but the inflation data helped spur Friday’s rally).
Starting with the most important event last week, the FOMC decision, it was both positive and negative, but in the end was taken as hawkish. The FOMC statement was positive in that the Fed removed the possibility of asset sales to reduce the balance sheet (this would have been a major negative surprise if the Fed said it was contemplating such a move), affirmed the balance sheet will decline via stopping reinvestments (which means a more gradual decline) and committed to using fed funds to slow the economy/combat inflation, not the balance sheet. Essentially, this removed the chances the Fed very aggressively tried to reduce the balance sheet, which would have been a substantial headwind on growth. However, Powell’s presser was negative for stocks because he essentially promised a March rate hike, and very much opened the door to a 50-bps hike or three hikes over the next three meetings (March, May, June). That means possibly five rate hikes in 2022, which is one more than the market was expecting. That was the biggest takeaway from the FOMC, and that is why stocks dropped in response, as the Fed once again was more hawkish than expectations.
Inflation data remained firm but there are some signs of peaking inflation pressures (if we’re really looking for it). The Fed’s preferred measure of inflation, Core PCE Price Index, met expectations rising 0.5% m/m and rose 4.9% y/y vs. (E) 4.8%. The Employment Cost Index, which is a quarterly reading of employment costs, wasn’t as bad as feared, rising 1.0% vs. (E) 1.2% quarter/quarter and 4.0% vs. (E) 4.1% y/y. And while those numbers are clearly much higher than the Fed wants them, they do further the narrative that inflation may have stopped accelerating. And in the context of a market that has priced in a very hawkish Fed, if inflation stats continue to hint at a peak, the Fed may not be as hawkish as initially thought (which could lead to a relief rally).
Finally, economic data last week was lackluster, likely reflecting the impact of Omicron on activity. Case in point, the January flash composite PMI dropped to the lowest level since April 2020, falling to 50.8 vs. (E) 56.7, barely in expansion territory. But while on the surface the data implies stagflation (which, if real, would be very negative for stocks), in reality this is likely an Omicron-related drop in activity that should reverse itself in the coming months.
For stocks to stabilize and rebound, they need: 1) The Fed to stop providing hawkish surprises, 2) Inflation data to peak and recede and 3) Economic data to remain firm to eliminate thoughts of stagflation. None of that happened last week, so Fed speak and economic data weighed on sentiment.
Important Economic Data This Week
This week brings the most important growth data of the month, and the key here is stability. Markets will want to see stability across the data to ensure we don’t have to worry about rising stagflation risks, because if stagflation concerns increase that will be another, unneeded headwind on stocks.
The key print is Friday’s jobs report, and the risks for this report are mostly one sided, as a “Too Hot” jobs report will only encourage the Fed to get even more aggressive with rate hikes. Meanwhile, unless the report is a complete disaster, it’s unlikely to make the Fed second guess rate hikes.
The next important reports this week come via tomorrow’s ISM Manufacturing PMI and Thursday’s Service Sector PMI. Based on the flash PMIs from last week, markets will expect a drop in activity, likely based on a temporary Omicron slowdown. But while it’s entirely likely Omicron is responsible for any sort of dip in economic data over the coming weeks, this is a market that has a confidence problem, so don’t be surprised if weak data causes a dip in stocks, even if it likely is Omicron related.
Conversely, stable data will go a long way towards reinforcing that the economic recovery is strong and likely can withstand initial Fed rate hikes. Additionally, there have been some initial declines in the price indices within the ISM PMIs, and if that continues in the January readings that will offer more evidence that that inflation pressures are starting to recede. That won’t make the Fed any less hawkish, but it will start to help the market believe the Fed is as hawkish as its going to get, and that would be a positive.
Finally, Fed speak will remain very important, and if Fed speakers continue to talk about more rate hikes (more than five) or sooner-than-summer balance sheet reduction, that will weigh on markets.
Bottom Line
To stabilize, markets need to see hawkish rhetoric/surprises from the Fed to stop, inflation data to peak and recede, and for economic data to be stable. If that happens this week, stocks can rebound.
Commodities, Currencies & Bonds
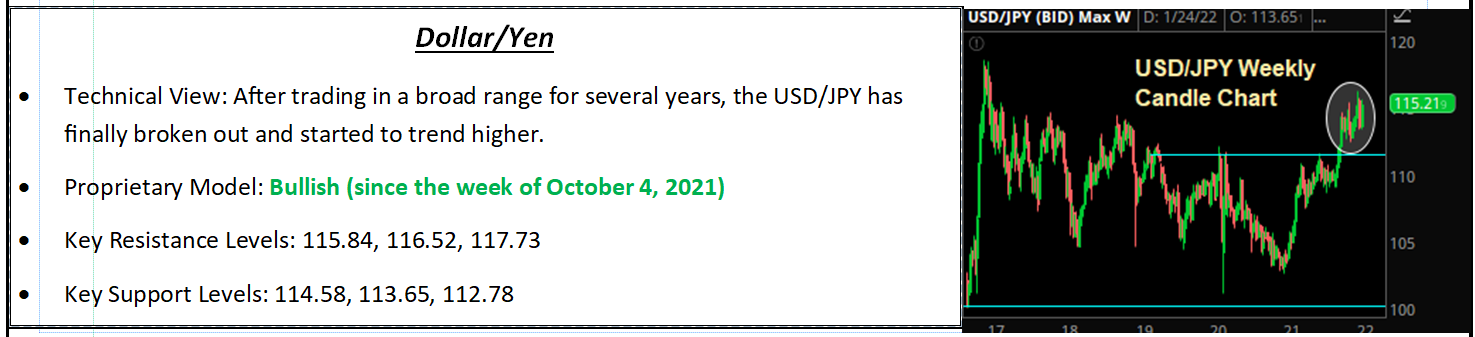
Commodities were mixed last week as energy extended recent gains on healthy fundamentals while industrial and precious metals declined on a surging dollar and worries about the Fed getting too aggressive. The commodity ETF, DBC, rose 1.50% to a seven-year high.
Natural gas made headlines last week when the expiring February futures contract surged by as much as 72% intraday and settled higher by 46% on Thursday. The EIA inventory report for natural gas was slightly bullish and some analysts suggested that the rally must have been the result of a short squeeze, but we find that unlikely as speculators typically move further out the expiration curve before the day a contract comes off the board. Ultimately, it seemed like there was a sudden supply panic in the physical market and traders rushed to buy into the front-month contract for delivery next month.
Bottom Line
Natural gas is still very much a weather-driven market, and we are likely to see more upside if temperatures remain well below average, leading to very strong demand.
In oil, the weekly EIA data showed a dip in U.S. production, underscoring that shale drillers are not yet responding to the higher futures market prices while demand remains better than feared as Omicron subsides and supply at the major hub in Cushing, OK, has very low stockpiles. WTI rose 2.90% on the week. The fundamental backdrop for oil remains bullish and we maintain a medium-term upside target of $105 in WTI.
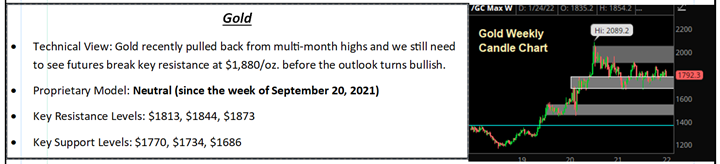
In metals, the hawkishly digested Fed was the major driver as the combination of a renewed upswing in the dollar, slower growth, and potentially fading inflation pressures as a function of new FOMC policy estimates weighed on both industrial (slower growth) and precious metals (easing inflation). Gold fell 2.39% on the week, violating a near-term uptrend line which now leaves the near-term outlook neutral while copper dropped a more-pronounced 4.58%. Copper also broke a key near-term uptrend and is flashing an early macroeconomic warning sign that points to, at a minimum, more volatility if not more weakness across risk assets broadly.
Gold

Dollar/Yen

Special Reports and Editorial
What Does the FOMC Decision & Powell Commentary Mean for Markets?
Last week’s FOMC decision and Powell’s presser was both positive and negative for markets, but in the end, it mostly reinforced what we know: The Fed is serious about raising rates, that’s going to pressure the market multiple, and it will keep markets volatile (but at this point it isn’t enough to end the bull market).
The Fed was positive in that within the statement and additional material on balance sheet reduction, the FOMC took off the table two potentially draconian tightening strategies: Asset sales to shrink the balance sheet and using the balance sheet to slow the economy. That reduces the chances of a near-term policy mistake.
But the Fed was negative in that Powell definitely opened the door to a 50-bps hike in March or three hikes in March, May, and June. That was more than the market was expecting, which is why 10s-2s flattened and stocks fell.
So that brings the market back to the central question: How many rate hikes are too many? The key remains the 10s-2s yield spread, and while it’s likely to break to new lows, it is still a fair distance from inversion—meaning that at this point the market does not anticipate the Fed killing the recovery in the medium term.
While that offers some comfort that the bond market still thinks the economic expansion can continue, we are still in a market where yields will rise, and the market multiple will be under pressure. That means we should brace for more volatility, and we should continue to avoid high-growth parts of the market, because the continued decline in the overall multiple will continue to hurt those sectors.
Positively, the S&P 500 is trading at a much more reasonable 19.4X 2022 earnings, so that does provide some cushion against further multiple reduction. And the economic expansion remains strong (looking past Omicron noise), so it’s not an environment that warrants a 17-18 multiple or some such (at least not yet).
Bottom Line
The Fed took some of the biggest threats to the market off the table but did reiterate that rates are going to rise quickly, and that means more volatility. We do not think the current macro-economic environment warrants moving materially to cash, but we think Powell’s commentary reinforces that rates are rising and that to best weather that we need to be in “quality” sectors, i.e., value over growth, cyclicals and defensives over tech, and sectors with strong dividends and capital return policies. Those sectors have outperformed YTD and we think that continues until the market has a better idea on how quickly the Fed will hike rates and what happens to growth.
Finally, we acknowledge that an over-aggressive Fed can, and ultimately will, end this bull market. But we think it’s a bit pre-mature to declare that now, given 1) Rates remain historically low and will be that way even with a 50-basis-point hike (remember rates were 2.5% in 2019), 2) Unemployment remains very low, and 3) Personal balance sheets remain very strong. All that could change, but at this point, while the financial media and investors are rightly focused on the Fed and the risks of rate hikes, there remain considerable positives. And unless you are very confident in your ability to trade out, and back in, over the next few months, we’d be inclined to continue to “hide” in high-quality, low-volatility names (SPLV, VTV, etc.).
Why Are TIPS Down YTD If Inflation Is Such a Concern?
Earlier last week, a long-time colleague emailed our research team with a question on the TIPS market and specifically asked why TIPS tracking ETFs were down YTD? We wanted to provide this email as it is a common topic of interest right now given the big moves in rates and ongoing debate about the inflation outlook.
Good Morning Aaron,
How have you been? I have been at this for 40 years now (started with EF Hutton working for your dad…. a long, long time ago) and admittedly, I need a quick refresher on TIPS. I Can’t quite figure why the VTIP and open-ended inflation protected funds are negative YTD? Do you mind giving me a quick explanation?
Thanks
This was our reply:
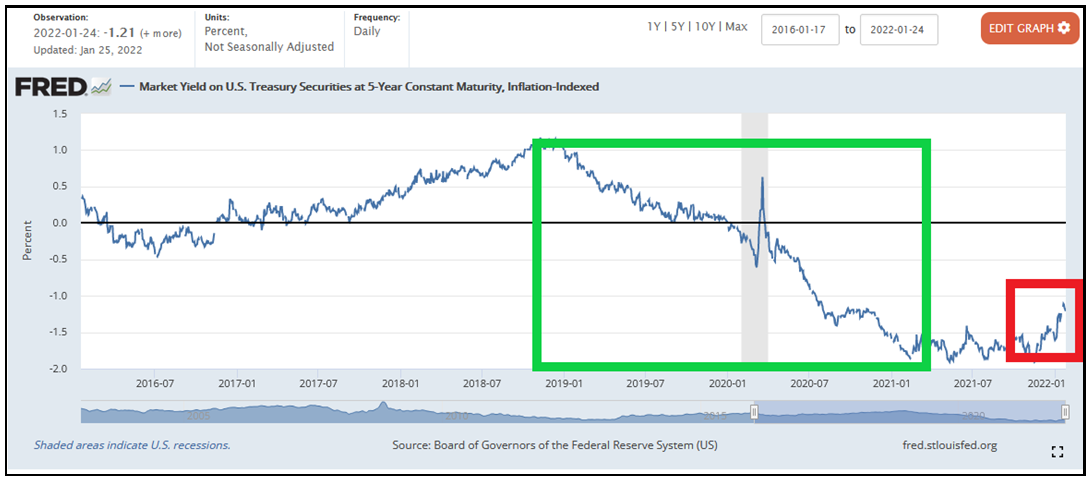
Funds such as VTIP own actual TIPS/track their performance, and despite all of the ongoing chatter about inflation and quasi-hysteria in the media about the Fed falling behind the curve in recent months, the bond market (being the smart market that it is) has been pricing in inflation since the start of 2019. The trend accelerated coming out of the initial pandemic shock given all of the stimulus money being pumped into the economy, and that sent 5-Yr TIPS yields decidedly negative, pushing -2.00% at the lows.
But since the economy began to stabilize in early 2021 and investors started to see the light at the end of the “COVID tunnel,” 5-Yr TIPS yields turned sideways (still in very negative territory) as investors remained concerned about inflation, thinking that the Fed was likely falling behind the curve given the rocky and uneven recovery in the labor market. As a result, real rates chopped sideways in very negative territory for much of 2021 while nominal rates steadily climbed higher. This resulted in market-based inflation expectations via 5-Yr Breakevens to rise, peaking at just over 3% in November.
Once the Fed took a more hawkish pivot in December, however, 5-Yr TIPS yields began to climb and recently reached new one-year highs as the market gained confidence that the Fed would, and could, control inflation given the hawkish shift in tone. Underscoring that point, the 5-Yr Breakeven inflation rate has pulled back by 40-50 basis points to the mid-2.70% zone, which is still above the Fed’s target but notably below the highs.
So over the last month, the market has actually become less concerned with the Fed’s ability to control inflation which led to profit taking in inflation-protected investments and a rise in TIPS yields, hence the negative YTD return for funds such as VTIP. The chart above offers a good visual of the 5-Yr TIPS yield with the green square encompassing the increased demand for inflation protection via TIPS beginning in 2019 while the red square shows the recent profit taking and the market’s vote of confidence that the Fed will be successful in containing inflation.
What Could Send 10s-2s Closer to Inversion?
At this point, the 10s-2s yield spread is reflecting five rate hikes (the 2-year is currently at 1.13%) as five rate hikes would bring the Fed funds rate to between 1% and 1.25%, so positively the short end of the bond market has priced in the Fed’s latest round of hawkish surprises. Given that, what could cause further compression in the 10s-2s yield spread?
One candidate is even more Fed rate hikes. For instance, if the market begins to think the Fed will hike six times this year (or more) then we’d see the 2-year yield rise to 1.50% or beyond, further compressing the curve. But we have to think more than five hikes is unlikely at this point.
Another, and more likely, candidate that could compress the curve is a slowing of growth or drop in inflation. Either would cause the 10-year yield to decline as the market priced in slower growth or less inflation, and in that instance, we could see the 10-year yield decline back towards the mid-1% range, further compressing the curve.
Given we think that is the more likely candidate, we’ll be watching inflation expectations and growth very closely, because if they begin to roll over, and the Fed stays hawkish, then the yield curve will compress further and move even closer to inversion, intensifying the “caution” light on the rally.
Oil Market Update
Weekly EIA Data and Oil Market Update
Other than a bearish oil inventory headline, the EIA report largely supported the bull case that demand remains strong while production is lagging expectations and supplies are tight.
Commercial crude oil stockpiles rose by 2.4MM bbls last week, which was a surprise against analysts’ estimates of a 800K bbl draw and the API’s 872K bbl decline. But that is largely where the bearish numbers end as gasoline supply rose 1.3MM bbls vs. (E) +2.3MM (API: +2.4MM) and distillate stocks fell by 2.8MM vs. (E) -1.6MM (API: -2.2MM).
Refinery use moderated by 0.1% more than expected to 87.7%, which was largely shrugged off as products supplied (implied consumer demand) rose 500K b/d to 22.4MM b/d while, potentially most surprising, domestic production edged down by 100K b/d to 11.6MM b/d despite the latest run to multi-year highs in the futures market. Finally, in regional supply developments, inventories at the U.S. oil hub in Cushing, OK, declined by nearly 2M b/d to 31.7MM b/d. That is back down towards a minimum operating level and suggests elevated demand by refineries.
Bottom Line
The three pillars supporting the oil market right now: 1) U.S. oil drillers not raising production despite higher prices, 2) High compliance by OPEC+ producers, and 3) Continued improvement in the demand outlook, all remain intact and suggest the path of least resistance is still higher for the energy complex. And last week’s uptick in geopolitical tensions offered an additional tailwind to energy, helping drive prices to seven-plus-year highs.
By Vann Equity Management