

Highlights
Key Takeaways
- Stocks
- How Bad Could It Get?
- What Makes It Stop?
- Economic Data
- Commodities, Currency, Bonds
- These are not easy times and this is the most difficult market any of us have seen in years, but we have been through markets like this before.
- Home prices must stop rising (and begin to consolidate) if CPI is going to drop meaningfully.
- The S&P 500 between 2,954-3,330 would be well-below historical norms and we would be strongly advocating for anyone with a time horizon over a year to be aggressively buying equities.
Stocks
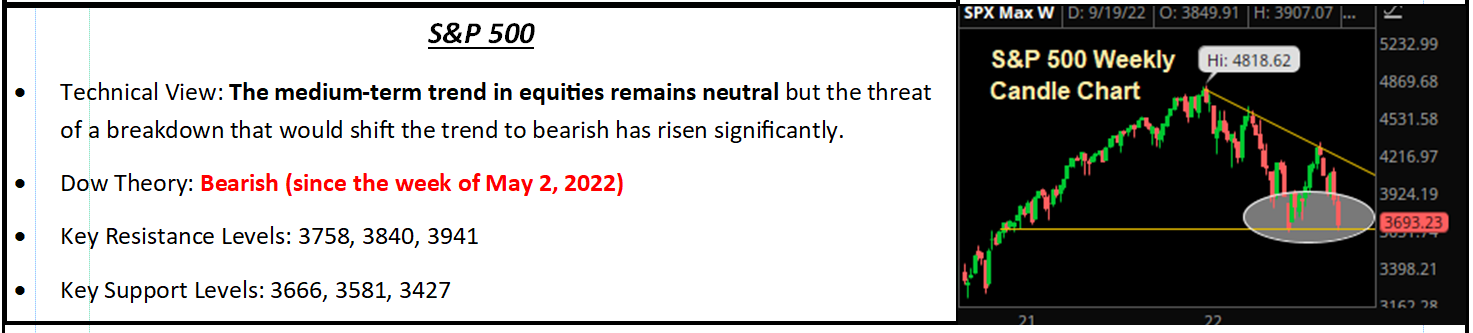
- Stocks extended the recent losses and tested year-to-date lows following a more hawkish-than-expected Fed decision, combined with a spike in global bond yields.
S&P 500
How Bad Can It Get and What Makes It Stop?
The S&P 500 plunged on Friday and finished the session near YTD lows, as a combination of negative momentum following the Fed’s hawkish rate decision combined with a violent macroeconomic reaction to the UK’s ill-advised stimulus plan. Simply put, enormous moves were made in the UK 10-Year for a typically well-anchored and widely owned asset—we are not talking about Greek bonds or the Turkish lira—we’re talking about the pound. That further unnerved investors and demonstrated that previous solutions to market stress (stimulus, either from the government or central bank) won’t work this time (this has been known for a while but it was put on display Friday).
Given stocks are just above fresh YTD lows, we wanted to cover what we believe are the two most important questions regarding this market: 1) How Bad Can It Get and 2) What Makes It Stop?
Question 1: How Bad Can It Get?
Early this month in our September Market Multiple Estimates Table (MMT), we outlined the “Gets Worse If” scenario and the first two points were: “The Fed hints the terminal rate will be substantially above 4%” and “Prices stabilize in September and hope shrinks for a quick decline in prices.” Well, the Fed did not hint at a terminal rate substantially above 4%, they put it in writing. Meanwhile, CPI didn’t fall. So, clearly the outlook for markets has deteriorated as the two major triggers for our “Gets Worse If” scenario have been elected. In the MMT, we cited a “worst-case” scenario for the S&P 500 of 3,300, which was the product of a recession multiple (15X) and $220 2023 EPS (nearly a 10% drop from the current expectation of $240). Our investment team remains broadly comfortable with that level as a fundamental worst-case scenario, as it factors in a recession and minimal yoy earnings growth.
Yes, there are numerous firms and research houses that have downside targets lower (3,150, 3,000, below 3,000). But to get to those levels, one would have to price in an extremely substantial economic slowdown and a multiple below 15X (which can happen but is rare) and intense earnings destruction.
Using history as a guide, from 1990 through 2006 (before QE, 0% rates, etc.) the average annual earnings growth rate of the S&P 500 was about 11%. If we use 2019 as our benchmark, then the “natural” 2023 S&P 500 EPS would be $211/share. In that instance, and even pressuring the multiple further, to say, 14X, that means a worst-case S&P 500 scenario would be 14*$211 = 2,954. So, if we think about how bad it could get, we’d say in a truly full negative scenario, somewhere between 2,954-3,330. To be clear, we are not saying stocks will get there as a lot more would have to go wrong for that to happen. But between 2,954-3,330 we’d be well-below historical norms on 1) valuation and 2) earnings growth, and we know we would be strongly advocating for anyone with a time horizon over a year to be aggressively buying equities in that range.
Question 2: What Makes It Stop?
There are three events that would help stop the market’s near-term declines.
- A soft CPI number. Next release Oct. 13. If CPI drops moderately, that will signal disinflation is quickly taking hold and we could easily see a 5% (or more) rally in this market because it would call into question the Fed’s dots and likely result in a decline in the terminal rate in the coming months.
- Better-than-expected earnings. Q3 earnings season begins October 14. Earnings concerns are pressuring stocks. If companies come out, like in Q2, and basically say business is holding up fine, that will go a long way to easing concerns about an imminent collapse in corporate earnings.
- Dovish Fed speak. The Fed has a consistent history of “blinking” on rate hikes when the economy comes under stress. If Fed rhetoric turns towards a slowing economy and building economic risks, then expectations for the terminal rate may begin to drift lower, and that would likely result in a big relief rally.
Bottom Line
These are not easy times and this is the most difficult market any of us have seen in years, but we have been through markets like this before. The factors that have weighed on stocks, higher rates, high inflation, hawkish Fed, have hit or are nearly at their peak, while the major stock indices are now sharply lower. Sentiment, meanwhile, has become extremely negative. While we can’t say the bottom is in, we do feel that we are closer to the end of this than the beginning, and all the market needs to stabilize is the hope that 1) Inflation is receding and 2) The Fed is close to the end of its hiking cycle. When those events occur, the market will stabilize.
Economic Data
What You Need to Know in Plain English
The Fed is trying to slow the economy to help bring inflation lower, and to feel that they are accomplishing their goal they need to see moderation in the economic data, and that’s not happening on a large-scale basis. Until it does happen (both with growth metrics and unemployment metrics) the Fed will remain hawkish and the elusive “Fed pivot” that the market needs to have for a bottom will remain unfulfilled.
Important Economic Data This Week
This week contains several anecdotally notable economic reports but no “big” monthly numbers so it’ll provide incremental color, but the data shouldn’t move markets unless there are material surprises.
Housing will be in focus this week via the Case-Shiller Home Price Index out Tuesday, and for one clear reason: Home prices must stop rising (and begin to consolidate) if CPI is going to drop meaningfully. We say that because the housing portion of CPI is almost 40% of the entire index, so unless home price gains moderate it’ll be very difficult for CPI to decline meaningfully. We also get weekly jobless claims, and we need to see these rise and the sooner the better, as that will help the Fed feel confident the current rate hike schedule is accomplishing its goal (and that will help dissuade hiking further).
Friday, we get the Core PCE Price Index, the Fed’s preferred measure of inflation. But it’s very unlikely we’ll see a sharp drop in the Core PCE Price Index without seeing it first in that month’s CPI (CPI will come out about 10 days before the Core PCE Price Index).
Commodities, Currencies & Bonds
- Commodities dropped 3.5% last week amid sharply rising fears of a global recession in the wake of hawkish central bank decisions around the globe that resulted in a continued rally in the dollar and rising real rates.
Industrial metals and energy were the notable laggards as the Fed decision caused a violent repricing of the outlook for economic growth globally. WTI crude oil futures were among the worst performers, falling 6.56% on the week to the lowest levels since early January, notably below $80/barrel. From a fundamental standpoint, declining demand expectations are trumping supply side concerns linked to the Russia-Ukraine war and over-compliance by OPEC+ producers. Until the macro-outlook stabilizes, oil will remain under pressure. Copper fell 5.45% on the week to a two-month low, violating near-term support at $3.40. Copper’s breakdown was a warning signal for the global economy and suggests rising risks of a further breakdown of risk assets. Focus now turns to the July lows of $3.22, which would solidify market expectations of a recession looming.
Gold
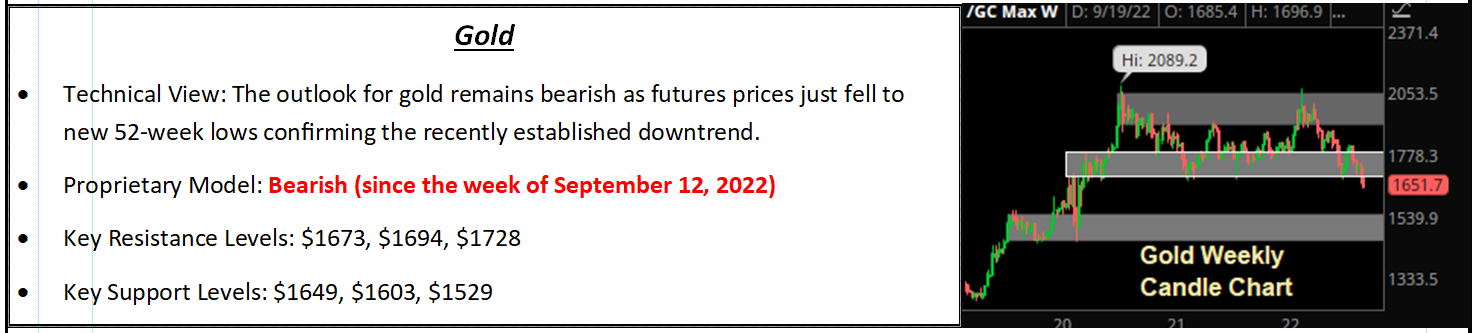
Gold relatively outperformed but still fell by 1.95% on the week thanks to rising real rates and dollar strength. And with no sign of those two trends letting up near term, the path of least resistance remains lower. Natural gas plunged 12.49% last week as part of the broader breakdown, but of all commodities, natural gas remains the most appealing with prices quickly approaching support between $6.50 and $6.70.
By Vann Equity Management