

Highlights
Key Takeaways
- Stocks: Why Stocks Dropped Last Week
- Weekly Market Preview: A Key Earnings Week (Results Need to be Good)
- Economic Data: Weekly Economic Cheat Sheet (Inflation in Focus Again this Week)
- Special Reports and Editorial:
- Understanding Why Longer-Duration Yields Are Rising So Sharply
- Financial Conditions Update
- Is Housing Starting to Lose Momentum?
- Oil Market Update:
- We are trading lower Monday 04/25/2022 on concerns about economic growth as COVID cases rose again in China while hopes for a diplomatic solution in Ukraine have all but faded.
- China is continuing with its “zero COVID” policy and with cases rising again markets are fearing more shutdowns, perhaps in Beijing, which is a negative for global growth.
- Russian President Putin essentially eliminated a diplomatic solution to the war, ensuring a further drawn out conflict, which will also be a headwind on global growth.
- Today there are no economic reports and no notable Fed speakers. Worries about global growth are the reason stocks dropped last week, so markets need some positive news on growth to stabilize in the near term.
- On the earnings front, this is a very important week and while the most important reports don’t come out until later this week, two reports we’ll be watching today are KO ($0.58) and WHR ($4.90).
Stocks
“Stocks dropped last week thanks to steep declines on Thursday and Friday as markets were again reminded that major global governments are removing stimulus and accommodation.”
Near Term Stock Market Outlook: Neutral (SPHB: 50%, SPLV: 50%)
✓ What’s Outperforming: Value and cyclical sectors have given back some of their early year outperformance in recent weeks, but as long as bond yields begin to rebound, value and cyclicals should outpace growth. RSP, XLI, XLV, XLP, XLF.
✓ What’s Underperforming: Tech and growth stocks have recovered some ground on value recently but we continue to believe that progress in the economic recovery and subsequently higher interest rates will be a headwind for tech and a rotation from growth to value can be utilized to reduce tech overweights, but not abandon super-cap tech holdings altogether.
S&P 500
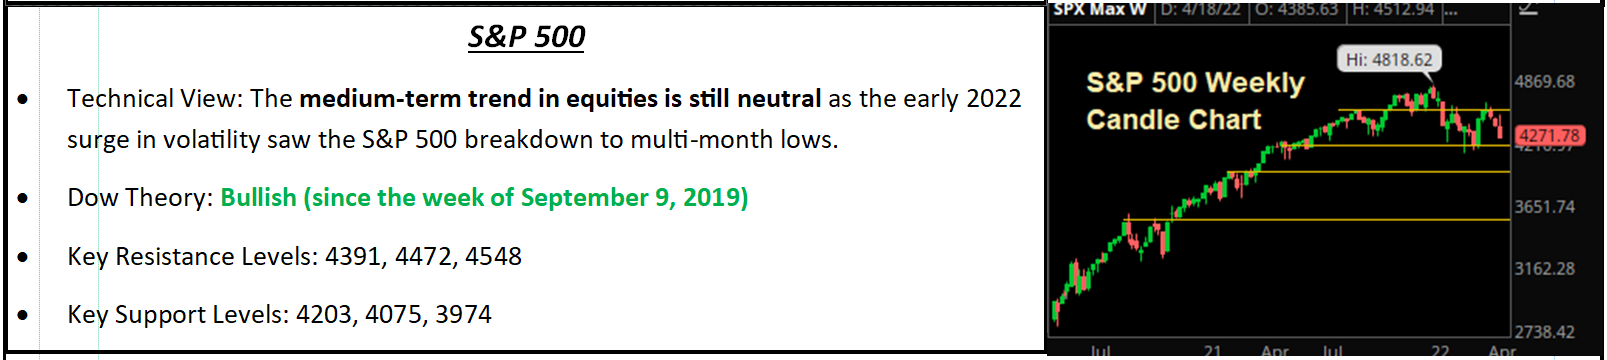
Last Week
Volatility picked up last week as an early week rally reversed sharply on Thursday amid more data pointing to stagflation, mixed earnings, hawkish Fed speak and a subsequent rise in bond yields. The S&P 500 dropped 2.75% on the week and is down 10.37% YTD.
The rally looked set to resume on Thursday as stocks gapped higher at the opening bell following upbeat earnings reports from TSLA and UAL, the latter of which was viewed as a positive macroeconomic signal. However, weekly jobless claims jumped more than expected and the Philly Fed Survey release pointed to stagflationary economic trends, which saw stocks reverse and begin to decline. Fuel was added to the fire, when Fed began giving hawkish commentary, guarding against excessive inflation; and fed funds futures began to price in the chance of a 75-bps hike at one of the coming FOMC meetings, leaving the S&P 500 to close down 1.48%.
The selling continued at the open Friday after some mixed economic data overseas while weak SNAP earnings weighed on tech. The April PMI (basically a number that ranges between 0 to 100. Above 50 represents expansion/Below 50 represents a contraction) came in at 55.1 vs. (E) 57.5, which further stoked stagflation fears and continued to weigh on general market sentiment. Investors continued to price in a more aggressive Fed with four 50-bps rate hikes being priced in between the May and September FOMC meetings, which left the equity market in a “no bid” selloff that lasted through the close, and the S&P 500 ended on the low ticks, down 2.77%.
Bottom Line
Stocks attempted to rally early last week, but global governments continue to take seemingly every available opportunity to remind markets that the global stimulus that sent stocks higher over the past few years is going away quickly and not coming back, and that general idea weighed on stocks on Thursday and Friday.
To that point, there wasn’t anything “new” that caused the drop in stocks on Thursday and Friday. Yes, Powell was hawkish in tone again, but the market already priced in a 50-bps hike in May. Perhaps the chances of three 50-bps hikes in May/June/July went up, but it doesn’t really matter—the year-end 2022 fed funds expectations are still between 2.50% and 2.75%, so it’s not like policy expectations were more hawkish last week.
Regarding Europe, ECB officials were hawkish and clearly guided markets to expect an end of QE and potential rate hike in July. But that’s not materially sooner than expected. Meanwhile, the hawkish commentary came from hawkish members of the ECB, the heads of the Bundesbank and Belgian National Bank. They aren’t always ECB consensus, so we must remember that.
Finally, China is continuing with its “Zero COVID” policy and that is a problem, first because it’s impossible to accomplish, and second because the longer they try, the more delayed a return to normal supply chain will become (which will keep inflation pressure elevated). But while the reiteration of the policy by President Xi last week was disappointing, it’s not a new negative (no one expected them to reverse course in the near term). Here’s my point: Yes, the general idea of global governments pulling support for the economy and tightening policy is a medium- and long-term problem for stocks, but none of that got materially worse last week.
Meanwhile, while it’s too early to declare earnings season “fine,” it has started off solidly. Expectations for 2023 S&P 500 EPS remain at $245, which makes the valuation of this market at these levels about 17.5X, which is, frankly, reasonable. It’s still a bit early to look at the market on 2023 earnings, but that will happen over the next three months.
The Thursday and Friday declines were painful, but they were not driven by any real deterioration of macro fundamentals. As such, we think the general trading range of 4,300 (ish) to 4,600 will remain in place, although a test of the March lows at 4,170 can’t be ruled out. However, unless we see 1) The Fed get even more hawkish (in actual policy, not just rhetoric), 2) A disappointing earnings season (this week and next are critical), 3) The Russia/Ukraine war expand or 4) Inflation continue to further accelerate, we’d expect the support from early March in the S&P 500 to hold.
We remain cautious on the outlook for markets over the medium and longer term and there will be a time when we really need to worry about slowing economic growth and a falling macroeconomic tide, but it’s unclear to us why that was a more pressing concern on Friday than it was last Monday (point being, nothing that bad happened). Until one of the previously mentioned four negatives occur, we think the 4,300ish-4,600 range (and the early March lows) will generally hold.
We continue to favor overweight allocations to 1) Defensive sectors, 2) Minimum volatility 3) Value styles and 4) Cyclicals/inflation securities as we continue to think they can outperform and better weather this still volatile market, as they have all year. Finally, this week earnings will be key. There are major reports from widely held names (AAPL and MSFT) and they need to be solid, otherwise a possible test of the March lows (4,170) shouldn’t surprise anyone.
Economic Data
What You Need to Know in Plain English
Need to Know Econ
Economic data last week showed the U.S. economy remained in a solid expansion, but at the same time the data points revealed just how prevalent inflation is in the economy, and while last week’s economic readings might now make the Fed more hawkish on its own, they will add fuel to the “hawks” debate about even more aggressive tightening, and that’s why stocks dropped.
The key report last week was Friday’s composite PMI, and it was a mixed number. The headline reading missed expectations at 55.1 vs. (E) 57.0, but the details were more mixed. The manufacturing PMI rose to 59.7 vs. (E) 58.1 amidst strong consumer demand. But the service sector PMI fell to 54.7 vs. (E) 57.9, which was a curious drop given that COVID restrictions have essentially been eliminated from the U.S. economy.
The reason cited in the report for the drop in service sector activity will definitely get the Fed’s attention: Inflation. The PMI report cited record price increases from service providers to keep pace with surging input costs, and that apparently reduced demand in April. Meanwhile, service providers also cited a continued lack of labor as a headwind on business activity. Bottom line, the hawks at the Fed will read this report as telling them 1) Inflation is rampant and 2) The labor market is very tight, and both of those factors imply even more aggressive tightening than is currently expected, although market expectations for rate hikes in 2022 didn’t change last week (but we’ll be keeping a close eye on them).
Stepping back, the positive news is that the flash PMIs are all solidly in expansion territory, comfortably above the 50 level. So, the economic expansion is ongoing. But this report clearly shows inflation is a problem for businesses, and that will only further embolden the Fed to tighten even more aggressively, so we’ll be watching closely for another hawkish shift in coming weeks.
The other notable manufacturing report last week, the Philly Fed survey, echoed the national flash PMI. The Philly Fed headline was a miss at 17.6 vs. (E) 20.5, but it remained solidly in expansion territory (above zero). But price pressures remained intense with price indices remaining very high, underscoring the prevalence of inflation in the manufacturing sector (and the economy).
The data last week is textbook for an economy that’s “running hot” with solid growth and very high inflation. And while last week’s data won’t make the Fed more aggressive, the case continues to build for even more aggressive tightening and balance sheet reduction, and if the Fed adopts that view, it’ll cause more volatility.
Important Economic Data This Week
Inflation is in focus this week, and if the inflation numbers run “hot” again don’t be surprised if the market begins to price in the chance of even more rate hikes by year-end (so potentially above 3% after the December meeting). The key number this week is Friday’s Core PCE Price Index, as that’s the Fed’s preferred measure of inflation. The March CPI was very high, but also the core number didn’t beat expectations and that’s leading some to hope inflation pressures are peaking—and if we see that echoed in the Core PCE Price Index that hope will grow (although clearly there needs to be a lot more evidence of inflation pressures peaking and receding before the Fed will get less hawkish).
In addition to Friday’s Core PCE Price Index, we also get the quarterly Employment Cost Index and the University of Michigan Inflation Expectations Friday morning, and those three numbers will give us a good view on the current state of inflation (and provide more insight into whether it’s actually peaking).
Outside of inflation data, we also get several updates on economic growth including, Durable Goods (Tues) and the first look at Q1 GDP (Thurs). Both numbers will be covered by the financial media, but unless there’s a shocking negative surprise (which is unlikely) they shouldn’t move markets. Bottom line, to rally, markets need signs of a peak in inflation and solid growth. If we get the opposite (high inflation and wavering growth) expect more declines.
Commodities, Currencies & Bonds
“Commodities dropped sharply last week on general global growth concerns as the Russia/Ukraine war dragged on and markets were reminded that major governments are withdrawing stimulus, which will be a headwind on growth.”
Commodities were mostly lower last week as increasing concerns about the outlook for the global economy weighed on industrial metals and energy, while gold dropped on rising interest rates. Natural gas also pulled back on profit taking after its massive rally of late. The commodity ETF, DBC, pulled back from multi-year highs to end the week with a loss of 3.38%.
Beginning with energy, WTI dropped 4.50% last week as traders digested the negative revisions to global growth outlooks by the World Bank and IMF as well as increasingly hawkish central bank chatter, which combined stoked concerns about policy-induced recessions emerging around the globe. An uptick in domestic crude oil production was another supply side negative for prices. Looking ahead, both major oil benchmarks have held the March closing lows so far in April, which leaves the trend still in favor of the bulls, but the rally has notably lost all momentum and the market is trading rangebound for the time being as the 2022 gains are digested. A break below the April low of $95.18 would shift the near-term outlook to bearish.
Natural gas futures pulled back 11.69% last week following a massive rally in the previous several weeks driven by low supply, a lack of new production coming online, and elevated weather driven demand. A short squeeze resulted in a bit of a “blow off top” at the start of last week as futures topped $8.00 and a countertrend pullback now is underway. The long-term trend does remain decidedly bullish, however, and support between $5.00 and $6.00 should hold.
In metals, copper bled lower last week with futures falling 2.91% as the global growth concerns trumped a drop off in production due to supply chain factors, rising costs, and protests near some mines in Peru. Support at $4.63 was decidedly violated Friday as futures dropped to a five-week low, which is an early warning sign for global risk assets for the weeks ahead.
Gold
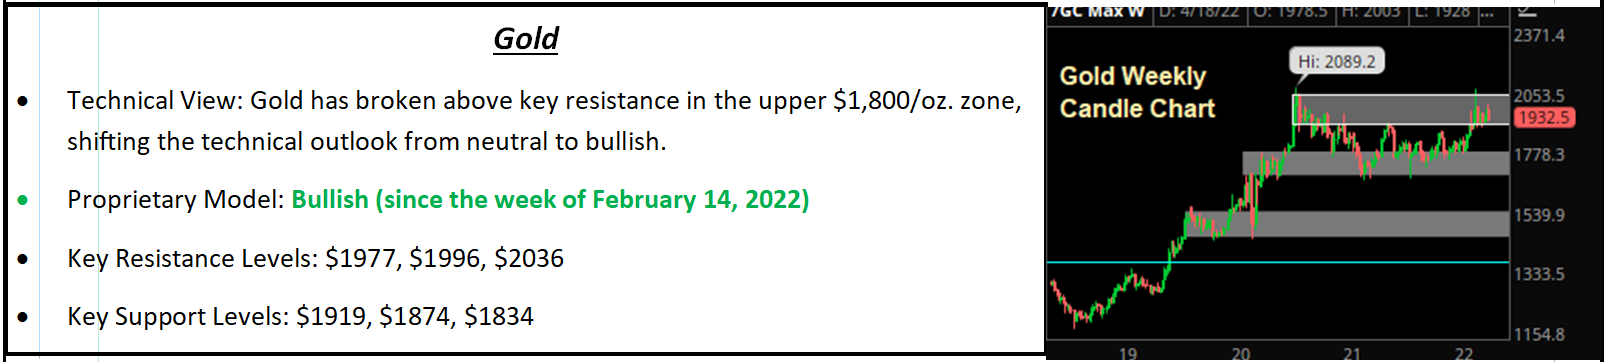
Gold pulled back 2.26% last week thanks to the combination of a rally in the dollar and rising interest rates. The 10-year TIPS yield notably turned positive for the first time since the pandemic hit, which is becoming an increasing headwind on precious metals. Inflation concerns are keeping the 2022 rally alive as futures held a key support band between $1,920 and $1,940 into the end of last week. A break below that near-term support would shift the trend from bullish to neutral.
10-Year T-Note Yield Futures
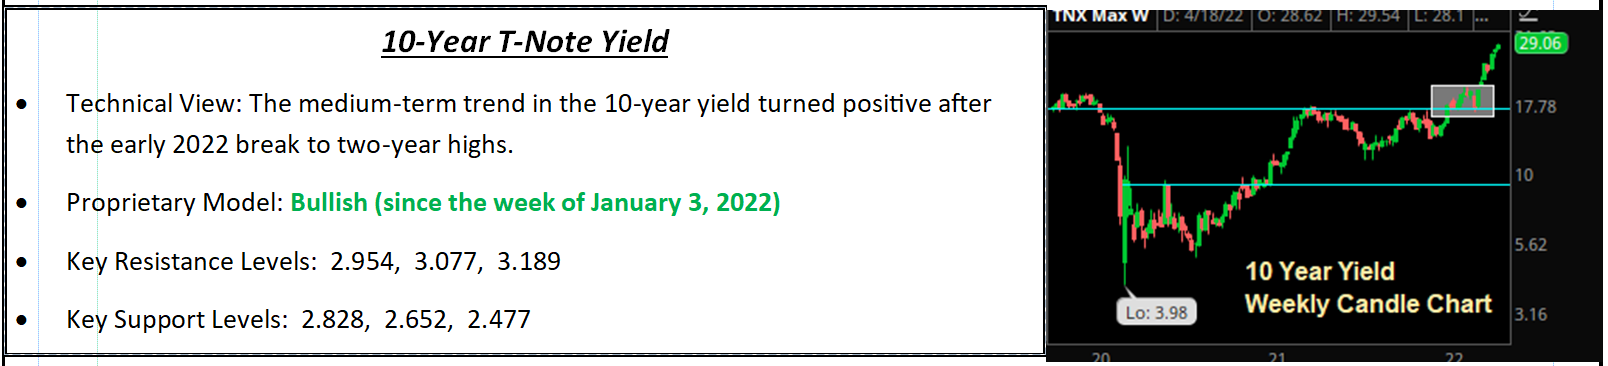
“The 10-year Treasury yield rose modestly last week, but importantly, the 10s-2s spread compressed further and it’s fading away from resistance near 30-40 bps.”
Turning to Treasuries, the key movement last week was in the 10s-2s spread. After rising to resistance at 40 basis point early in the week, we saw a sharp reversal and decline in the 10s-2s spread following the hawkish Fed rhetoric late in the week. The 10s-2s yield spread fell to 17 basis points by week’s end, and if we see a continued decline towards 0% again, that will only further solidify that the bond market is predicting a future slowdown. Looking at the 10-year yield, it came close to breaching 3% last week, but settled just under 2.90%, up 5 basis points on the week. But it remains only a matter of time until 3% is “taken” by the 10-year yield.
Special Reports and Editorial
Understanding Why Longer-Duration Yields Are Rising So Sharply
The rise in global bond yields has accelerated over the past several weeks, as Treasuries and many international bond yields have moved to multi-year highs. We want to make sure everyone understands why that’s happening, what it means if it continues, and how to allocate to seize opportunities or protect portfolios.
First, before we begin, it’s important to remember one key fact: Bond yields only rise because investors are selling bonds. Rising yields are a consequence of falling bond prices, which occurs when investors sell bonds. This is an obvious point, but in this discussion it’s important to realize that yields aren’t rising by themselves—they are only rising because investors are selling bonds.
And the selling has been intense as the 10-year Treasury yield has risen from 1.52% on Jan. 1 to 2.92% now, which is the highest level since 2018.
Part of the reason for this rise in yield has been increase in German bund yields. For long-term readers, you know that we and others have cited foreign demand for Treasuries as a major reason that yields used to be so low. To that point, for the past several years, the yield on the 10-year German bund was negative compared to a 10-year Treasury yield of over 1%. That spread invited foreign investors to move into Treasuries.
But times have changed. The 10-year German bund yield has surged to positive 92 basis points, up from -18 basis points to start the year. And now that German bund yields have turned solidly positive, we’re seeing foreign investors sell Treasuries and rotate back into Bunds. So that selling now is another tailwind on rising yields.
Given that, it leads us to this question:
Why are investors selling government bonds?
For high-quality government debt (where default is not a near-term concern), there are only two answers to that question: 1) Because investors expect a stronger economy and 2) Because investors fear higher inflation.
With major global central banks hiking rates aggressively in the coming months and numerous threats to growth from the Russia-Ukraine war, it’s unlikely the bond market is pricing in a future acceleration of growth from here.
So, what is likely causing this selling in longer-duration bonds is investors anticipating higher than previously expected inflation. How is that the case if central banks are going to hike rates so aggressively? Well, it means the market doesn’t think they will hike rates aggressively enough.
This is especially true from the ECB, as this most-recent selling in Treasuries and bunds has come after the recent ECB meeting, where the ECB wasn’t hawkish enough. But it’s not just the ECB that the market appears to be doubting—it’s the Fed too. Here’s how we know.
Until a about a month ago, the 10s-2s spread was falling because the 2-year yield was rising faster than the 10-year yield. That reflected the bond market’s opinion that the Fed would hike rates so quickly and so aggressively that it would overcome economic growth—and that’s why the yield curve inverted.
But following that, the 10s-2s spread has widened back out above 30 basis points, a multi-month high. And that has come as the increase in the 10-year yield has outpaced the rise in the 2-year yield.
From April 1, when 10s-2s inverted, until Monday, the 2-year yield rose just 3 basis points, from 2.44% to 2.47%. Meanwhile, the 10-year Treasury yield rose 56 basis points.
This tells us that the bond market priced in the Fed’s hawkishness, and implied it wasn’t going to be enough to quell inflation (or, more likely, the Fed won’t go through with all its hikes once the economy begins to roll over).
What Does This Mean If It Continues?
We’ve been saying the bond market is at another inflection point, because one of two things will happen. Either the 10s-2s spread will continue to widen as the 10-year yield rises and implies that inflation will be higher for longer, or 10s-2s will roll over and head back towards inversion, implying the bond market thinks the Fed may go through with cooling the economy to slow inflation.
Where 10s-2s goes from here (decisively above 40 bps or back below 30 bps) will offer important insight into which economic reality might be coming in the next few quarters, i.e. continued inflation, or slowing growth.
What Does This Mean for Markets?
It means a lot, because it’s important for tactical allocations. If 10s-2s continues to widen out that means higher inflation for longer (i.e. the Fed won’t break it) and in that set up we want to own even more inflation-linked assets: Commodities (PDBC), REITs/real estate, value over growth (yields will be rising), and we’ll want to resist the temptation to move to cash.
However, if 10s-2s rolls over and heads back towards zero, that implies that the market is expecting a slowing of growth, which means we’ll want to focus allocations on value over growth. Bottom line, the bond market is in flux and sending important signals to investors about future growth and/or inflation—and we will continue to watch the bond market closely as we continue to believe it is the “smart market” and provides great insight into what’s coming next, not just what’s happening now.
Financial Conditions Update
One of the reasons for the rally in stocks at the beginning of last week has been better-than-expected earnings results, especially from the airlines, as DAL, UAL and AAL all beat estimates and, most importantly, gave very positive commentary on the outlook for travel demand.
Why is that a surprise? By any measure, the economy is strong right now. Economic indicators show solid strength. Wages and income are up. Unemployment is low and personal savings are higher. Yes, higher inflation is eating into disposable income, but not materially—at least not yet.
Meanwhile, for all the constant discussions about Fed tightening, none of it has really started yet.
To illustrate this point, we looked at the Chicago Fed National Financial Conditions Index. This is an index that measures four parameters to determine whether financial conditions in the U.S. economy are looser than average (which stimulates the economy) or tighter than average (which would be a headwind on growth). They remain very solidly “looser” than average, meaning that financial conditions (which factors in Fed policy, market interest rates, measure of risk taken in the markets, leverage, credit availability) show that financial conditions are not even neutral, they are still actively stimulating the economy!
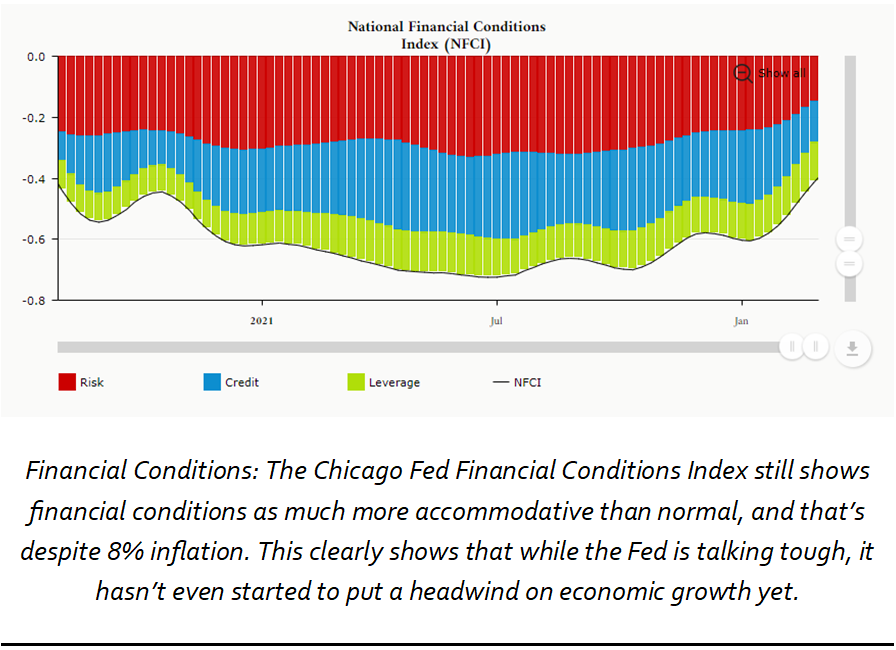
More specifically, the index is set so that “0” is average, meaning an index reading of 0 means financial conditions are no looser or tighter than average. As of last week reading, financial conditions are solidly negative (-0.37) and have only retraced half of the move from the most accommodative levels back in the summer of 2021 (the index was at -0.72). And over the past week, financial conditions have eased further.
Meanwhile, inflation is at 8% yoy!
Here’s our point: It should not surprise anyone that earnings results are solid and airline CEOs are optimistic about the future. Aggregate demand is still very strong, Fed policy and financial conditions are still actively stimulating growth despite 8% inflation! Again, it should not be a shock that CEOs in disposable income-oriented sectors are posting strong results and are optimistic about the outlook.
Then again, they always are before economic “turns.”
We are not saying an economic turn is imminent, but we are pointing this out to illustrate the that we have strong economic growth and high inflation, and Fed policy is still accommodative to both of those factors. It’ll only be after the Fed has hiked through the summer and QT starts that we’ll start to see the impact of those hikes.
Bottom line, we are happy earnings are better than feared so far and we are happy stocks have rebounded, somewhat. But we think it’s wise to be skeptical of optimistic macro commentary from airlines and other consumer goods companies because, right now, the business is booming. But I think Jamie Dimon’s comments are worth keeping in the back of our mind—that he’s nervous about a future slowdown and JPM is building reserves in case that occurs. So, it’s not the economy now we’re worried about, it’s the economy in the coming quarters, and nothing in earnings results so far has reduced that concern.
Is Housing Starting to Lose Momentum?
✓ March Existing Home Sales declined to 5.77M vs. (E) 5.86M
✓ March Single Family Housing Starts declined -1.7% to 1.2M
✓ March Single Family Permits declined -1.2% to 1.148M
Takeaway
For the first time in a while, we are looking more closely at the housing data to see if surging mortgage rates were starting to impact the market, and there are some signs that’s starting to occur.
First, mortgage rates have continued to tick higher, with the Bankrate.com national average rising to 5.27% (and we’re seeing quotes for 6% mortgages for the first time in well over a decade) and undoubtedly that’s going to put some headwinds on demand.
More broadly, the monthly housing stats are starting to show a loss of momentum, as Single Family Starts and Single Family Permits (which are a three-to-six month leading indicator of starts) also declined in March (the headline Housing Starts number reported in the financial media isn’t a useful number—it’s the Single Family sub-indices that really give insight into residential housing). Finally, Existing Home Sales missed expectations for March, although that wasn’t so much due to lack of demand as it was due to continued lack of supply.
To that point, while sales data is important, really the key to the housing market is price. In many markets, especially here in Dallas, Texas, the price appreciation has become too intense and occurred so rapidly that the housing market is not a well-functioning market right now. Here’s what we mean.
Many people who bought houses before the pandemic are sitting on large paper gains. Normally, that would spur an “upgrade” cycle where people sell those houses and roll the gain into a bigger or nicer house. But because the price appreciation has been so extreme, that cycle is broken because the profit from the current house doesn’t buy anyone a nicer or bigger house anymore.
What we are witnessing in the housing market, especially in Dallas, is the real-life example of this principle: If everyone is rich, no one is rich, and this is the true danger of inflation. Yes, most people who bought homes pre-pandemic are sitting on massive gains, but that gain does them no good in the marketplace because any house they would buy has appreciated as much, or more, rendering the gain in the house useless (unless that person wants to sell and rent, but that’s a directional call on housing and a different story).
Point being, in many areas home prices are so overvalued that it’s stopped normal market functioning. Existing homeowners are sitting on large gains, but the gains do no good because they don’t buy a nicer house! As a result, no houses are for sale. That, in turn, has created a buying frenzy for any houses that are for sale—which only exacerbates the price issue.
We are sure you have heard people say this (or thought it yourself): Sure, I can sell, but where would I go? And it’s not just in houses, it’s also in cars, boats, planes, RVs, second homes, etc. The price appreciation that’s occurred has been so rapid that it’s essentially trapped people in their assets. Yes, there are large paper gains, but the gains do no good with regards to buying a nicer asset, because all prices are equally inflated.
That’s why the Fed must get inflation under control, as inflation is breaking the normal functioning of markets.
Relating this back to housing, to fix the market, prices need to, at a minimum, 1) Flatline for a while, so that relative value can re-appear in the market and supply can increase and 2) Ideally decline (albeit modestly) and reignite supply, so that the market begins to function more normally.
That makes the key metric in housing price, not sales; and there are no signs that the price of houses is falling (or even flatlining). Now, given the uptick in mortgage rates we will be watching home prices closely for signs of a decline, because if we start to see that happening it will be an early sign of a slowing economy. Again, though, it’s not happening yet.
Finally, just to be clear, we are not saying we are about to see 2008 again. The 2008 housing crash was a nightmare for virtually all of us and we sincerely hope that is the only housing crisis we ever see in our lifetime. However, that housing bubble was caused by leverage, rampant speculation, and dereliction of duty by underwriters and regulators. The current boom in housing is really a supply phenomenon. There is not enough supply and that is causing prices to spike. Further there is not the enormous amount of leverage in the system anymore, lending standards are still relatively solid, and banks are better capitalized. So, we can have a normal moderation in the housing market alongside an economic slowdown—it doesn’t have to be 2008 again.
Oil Market Update
Natural Gas Update
The 2022 rally in natural gas has gone parabolic so far in April with prices up over 100% from the turn of the year as unseasonably cold temperatures are driving elevated spring heating demand in the U.S. amid an already-bullish fundamental backdrop of subdued inventory levels and no real signs of rising production near to medium term.
To that point, inventories now are sitting 23.9% lower than the same period last year, and 17.8% lower than the five-year average. That paired with strong demand so far in the spring “shoulder season,” when supply is supposed to build substantially before summer demand picks up, has bolstered prices as supply is expected to remain well below average for the foreseeable future. Natural gas futures added another 6.68%.
On top of the traditional bullish fundamentals of low supply and relatively strong demand, the geopolitical unrest in Eastern Europe is keeping a bid under the market as Russian energy exports could come to a halt at any time, although that is admittedly not likely as Europe is dependent on Russian oil and gas and Russia needs the money as the war in Ukraine rages on. The war in Ukraine also has prompted increased LNG imports to Europe, including those coming from the U.S. and that is another reason we are seeing our domestic prices running higher right now.
On the charts, the recent new highs in natural gas confirm the current uptrend in prices that began in earnest in mid-March and based on the price action since the October highs, the new upside target for nat gas futures is $9.06/mmBtu. Natural gas futures have become near-term overbought, however, and a pullback on any bearish news should not come as a surprise. In such an event, we should look for initial support near $6.33 and more formidable support down near $5.50, but a drop to either of those targets would likely present a buying opportunity based on both the bullish fundamental backdrop and increasingly positive technical trends.
EIA Takeaways and Oil Update
With the exception of domestic production data, the weekly EIA report was mostly bullish for energy near term. On the headlines, commercial crude oil stockpiles dropped a sharp 8.0MM bbls last week vs. (E) +2.2MM (API: -4.5MM), which was a rather bullish surprise. Gasoline inventories fell -800K bbls which met estimates but was bullish relative to the API’s +2.9MM while distillate supply dropped -2.7MM vs. (E) -900K (API: -1.7MM), also bullish.
Products supplied rose by 262K b/d to 19.033M b/d which shows an uptick in consumer demand, and that was underscored by a slightly larger-than-expected jump in refining activity as it rose 1.0% to 91.0% vs. (E) 90.6%.
Production edged up 100K b/d to 11.9MM b/d on the week, the highest since the depths of the pandemic lockdowns in early May 2020, which suggests U.S. producers are increasing output amid high prices and domestic production may begin to trend higher in the months ahead. While it is not enough to offset the losses from Russian oil companies near term, U.S. producers could add another 1 million b/d in production in a return to pre-Covid levels and that would balance a good portion of the lost barrels from Russia on the global market.
Bottom line, the EIA data was bullish across the board, especially regarding demand metrics, but the new two-year high in U.S. oil production was the key bearish exception. This week, the market’s focus has shifted to the supply side as rising production in the U.S. paired with significant plans for reserve releases over the next six months is offsetting fears about lost Russian production. Demand side news flow also has been largely bearish this week with Covid lockdowns in China hurting consumption while negative revisions to global growth expectations by both the World Bank and the IMF have added downward pressure to the market.
Looking ahead, oil is still rangebound between $95 and $111/barrel. And despite growing fundamental headwinds on the market, a breakdown below key support at $95.18 (on a closing basis) is still not very likely until there is some progress towards a ceasefire between Russia and Ukraine, leaving our near-term market outlook neutral.
Sincerely,
Vann Equity Management Investment Committee
By Vann Equity Management