

Highlights
Key Takeaways
- When Could the Selling Stop?
- Weekly Economic Cheat Sheet
- FOMC Decision
- Oil Update
President Biden and St. Louis Fed President, Jim Bullard, both downplayed the threat of a severe recession this morning which is helping this morning’s rally in the equity markets.
For this morning’s relief rally to continue today the market will need to see stable price action in bond markets, economic data meet or beat expectations, and Fed officials to maintain an optimistic tone as that could see the S&P 500 test near term resistance between 3,780 and 3,840.
Stocks
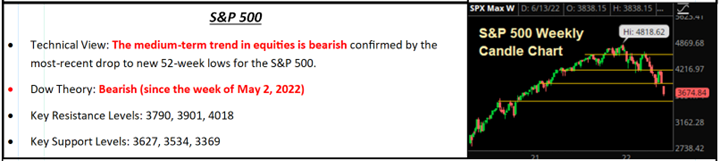
S&P 500
When Could THE SELLING STOP????
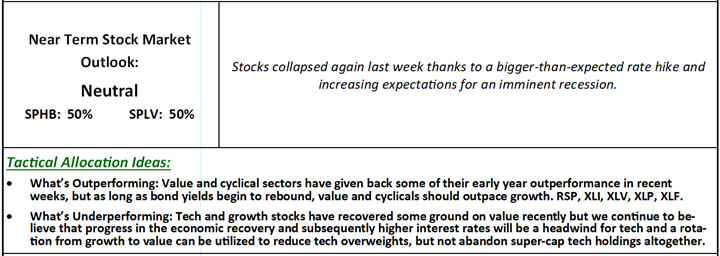
As we all are painfully aware if you have been watching your investment accounts, stocks were hammered last week because of two main reasons: A bigger-than-expected rate hike and exploding expectations of an imminent recession. Those two forces combined with extreme negativity and investor hopelessness sent the major indices to fresh lows of 3,666 on the S&P 500.
Fundamentally, the news last week wasn’t nearly as negative as the market reaction implied. The Fed hiked 75 bps but didn’t materially increase the “terminal” fed funds rate, meaning that bigger rate hikes just mean all this gets over with sooner than later (again it’s the “terminal” fed funds rate, i.e., where they stop hiking, that matters most).
Meanwhile, there was plenty of good corporate news last week (although that’s all being ignored). Fundamental headlines don’t matter in the short term when markets are this negative, and the best use of our time now is determining where this downward spiral might stop.
On a valuation basis, our work has given us a range of 3,450-3,680 for a sustainable bottom. However, this range comes with a function of time and is not just a touch and go check the box and move higher type of situation. This range also coincides with the technical measured move target of 3,625, so we should not be surprised if markets briefly stabilize here and there’s an oversold bounce in the short term.
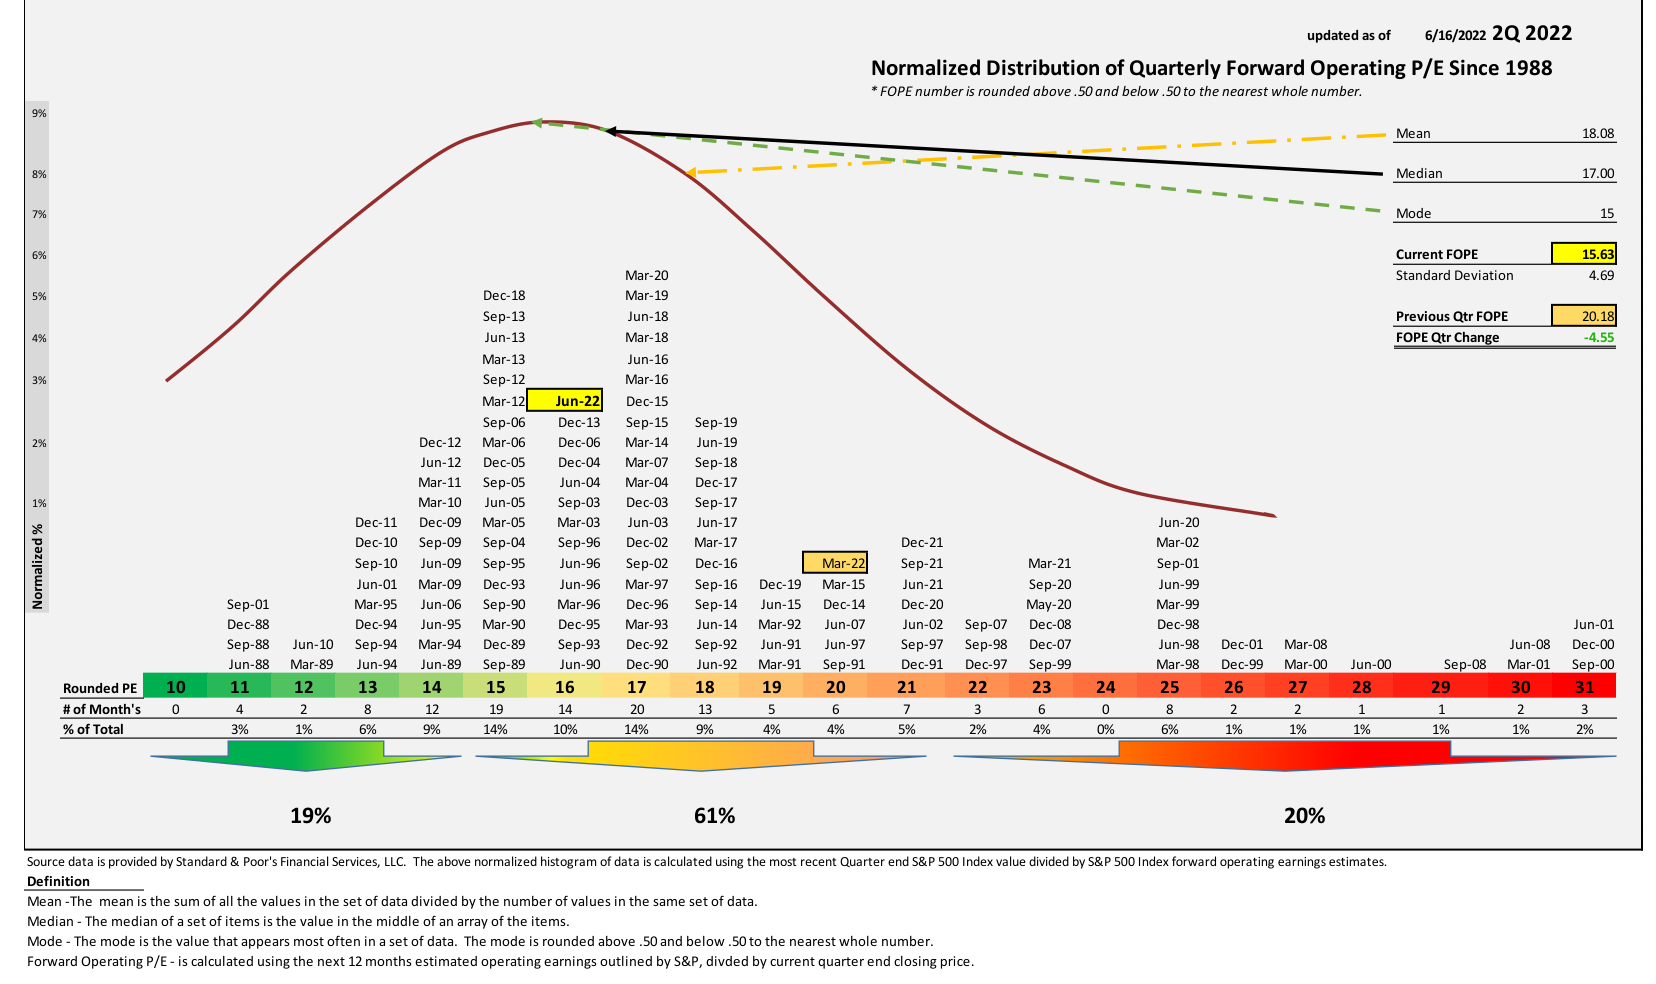
Beyond the short term, our “Gets Worse If” target range in the S&P 500 has been based on an expected $230/share for 2023 S&P 500 Earnings Per Share (EPS). However, driven mostly by exploding negativity (and not actual corporate results) many wall street analysts are now penciling in $220/share for 2023 S&P 500 EPS. Using a 15X multiple * $220 EPS number gives us a “worst case” downside target of 3,300 in the S&P 500, or another 10%-ish from here. We think that is a reasonable “worst case” scenario. See Chart 1 Current Valuation page 5
From a catalyst standpoint to regain a bullish longer term uptrend, our “Three Keys to a Bottom” remain in effect and none have been reached yet. Those three keys remain: peak Fed hawkishness, peak inflation, and declining geopolitical risk; so, we can’t say a bottom is in YET. In the short term for stocks to bounce from here, oil dropping would be a material positive, as it would take pressure off inflation metrics and potentially lay the foundation for disinflation in the coming months. If oil can sustainably drop, stocks can rally (but again that’s not a bottom).
Economic Data
What You Need to Know in Plain English
The Fed was the market’s main focus last week as the 75-bps rate hike was the largest in 28 years; however, there were notable, and mostly negative, economic developments as well. The combination of an increasingly hawkish and aggressive Fed and deteriorating economic data, weighed heavily on risk assets over the course of the week as recession and stagflation fears rose considerably.
Starting with the Fed decision, the FOMC voted 9-1 to raise the fed funds rate by 75 bps to a range of 1.50% to 1.75%, which was in line with the rapid shift in expectations coming into the week, but above the initial 50 bps that were previously priced in. The Fed reiterated its “strong commitment” to getting inflation back to its target of 2% and suggested a data-dependent path forward for policy. The “dot plot” showed that the Fed plans to raise rates to 3.4% by year end, which was significantly higher than the March projection of just 1.9%. So it just became that much more expensive to purchase a house, a car, and forget about high interest credit card debt.
Regarding economic projections, the Fed expects the labor market to remain strong through the end of the year but growth to fall considerably from 2.8% to just 1.7%, and inflation expectations were revised up to 5.2% from 4.3%. However, new projections are for inflation to fall back to 2.6% in 2023 and 2.2% in 2024.
Finally, Powell said that 75-bps hikes are not going to be typical going forward, which is the comment that the market most strongly reacted to as it rallied to session highs shortly after, but he also noted that a soft landing is becoming increasingly difficult to envision.
Bottom Line
It is becoming increasingly apparent that the two possible paths forward are 1) The Fed doesn’t hike enough and falls behind the curve entrenching inflation for the foreseeable future, or 2) They overtighten and choke off growth sending the economy into a recession. That binary outcome is largely the reason stocks dropped so sharply on Thursday.
Last week’s developments were not positive for markets as the Fed confirmed it is getting more aggressive in its inflation fight while economic data very clearly showed a loss of positive momentum in growth and sentiment in the face of the highest inflation pressures in decades. As such, it is going to be increasingly difficult for the Fed to pull off a soft landing and not trigger a recession in the months and quarters ahead.
Important Economic Data This Week
The economic data for this week slows significantly; however, there are a slew of Fed officials speaking over the course of the next few days. What the market does not want to hear is increasing concerns about a recession given recent economic data, or hints, that the Fed may not get to its year-end fed funds target; as that would result in renewed fears that the Fed will fall behind the curve and allow 1970s-style inflation.
On the data front, the most important releases come in the back half of the week with weekly jobless claims and Flash PMI data due out on Thursday and Final Consumer Sentiment for June, due out Friday.
For stocks to stabilize we will want to see jobless claims fall back from recent highs, preferably above estimated PMI data on Thursday, while the inflation expectations within the Final Consumer Sentiment release will be closely watched. A dip in inflation expectations would be well received as that was one of the main catalysts behind the Fed’s shift to moving forward with a 75-bps hike versus 50 bps last week, and it would suggest that inflation may actually already be peaking thanks to Fed actions. Additionally, any revision up from the preliminary headline print of 50.2 in the June Consumer Sentiment data, which was a record low, would be a positive.
Bottom line, investor doubts about the Fed’s ability to pull off a soft landing have grown considerably over the last two weeks and that is a clear negative for stocks and other risk assets. But if data begins to reverse those doubts in the near term with inflation fears easing, and economic data firming, stocks could stabilize as the prospects of a soft landing would improve. Given the latest economic data, however, that is becoming a long shot.
Commodities, Currencies & Bonds

Commodities were volatile last week as industrial metals and energy were hit hard on recession fears and a rising dollar, while gold declined but relatively outperformed thanks to elevated demand for safe havens amid the broader market turmoil.
WTI crude oil futures dropped a sizeable 9.62% after testing the early March highs at the start of June. The declines began early in the week with risk-off money flows in other asset classes spilling over into energy as recession fears rose amid more aggressive central bank policies around the globe. Oil output in the U.S. also rose while legislation to tax profits beyond 10% in the U.S. energy sector triggered a heavy wave of selling. Looking ahead, the long-term uptrend in oil is still intact with critical price support lying between $99.50 and $102.50 as a break below would shift the technical outlook. Fundamentally, various factors including Chinese lockdowns, recession fears, and legislation threats will move markets on an intraday basis but the war in Ukraine remains the dominant influence on energy.
Copper dropped sharply on Friday amid increasing concerns about a looming global recession. Copper ended down 6.24% on the week. The drop below support at $4.08 was a negative anecdotal signal from the industrial metals market that the global economy is not only losing momentum, but we may indeed be on the brink of a recession. We will look for copper to stabilize as one factor that could suggest we are nearing a bottom in the latest equity rout.
Gold
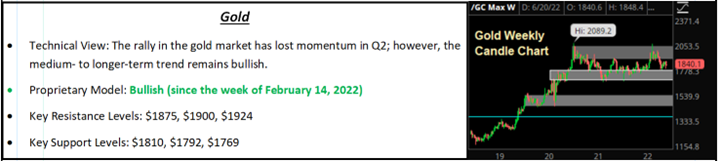
Gold fell to a more modest 1.78% on the week and unlike copper, gold futures were able to hold above near-term technical support at $1,810. The pullback in bond yields into the end of the week helped offset a rise in the dollar and fading inflation expectations due to the Fed’s 75-bps hike. The odds of a breakdown in gold will rise in lockstep with the dollar and yields as they are the two biggest headwinds for yield-less safe havens right now.
Oil Market Update
The oil market has begun to take another breather from the rally that occurred over the last five weeks or so thanks to growth concerns weighing on the demand outlook. However, the ongoing war in Ukraine will likely keep a bid under the market from a supply standpoint until we see some resolution in the conflict as there is still no replacement for Russian exports that have been suppressed by sanctions since Russia invaded Ukraine.
Chart 1: Current Valuation
By Vann Equity Management