

Highlights
Key Takeaways
- Weekly Market Preview: Do Falling Treasury Yields Fuel More Upside in Stocks?
- Weekly Economic Cheat Sheet: Is the “Growth Scare” Starting to Appear?
- Oil Market Update
- What the Fed Decision Means for Markets
- Post-FOMC Technical Levels Update
Stocks
“Stocks enjoyed their best week of the year last week thanks to Fed Chair Powell strongly hinting the Fed is done with rate hikes, Goldilocks economic data, and a smaller-than-expected future borrowing estimate by the Treasury.”
✓ What’s Outperforming: Growth factors, tech, consumer discretionary and communication services, the worst performers in 2022, have outperformed YTD. However, higher yields remain a headwind and as such we do not think this outperformance will last over the longer term.
✓ What’s underperforming: Defensive sectors and value have underperformed YTD but are still massively outperforming since the bear market started in 2022, and since our primary concern in 2023 is economic growth, we think underperformance will be temporary.
S&P 500
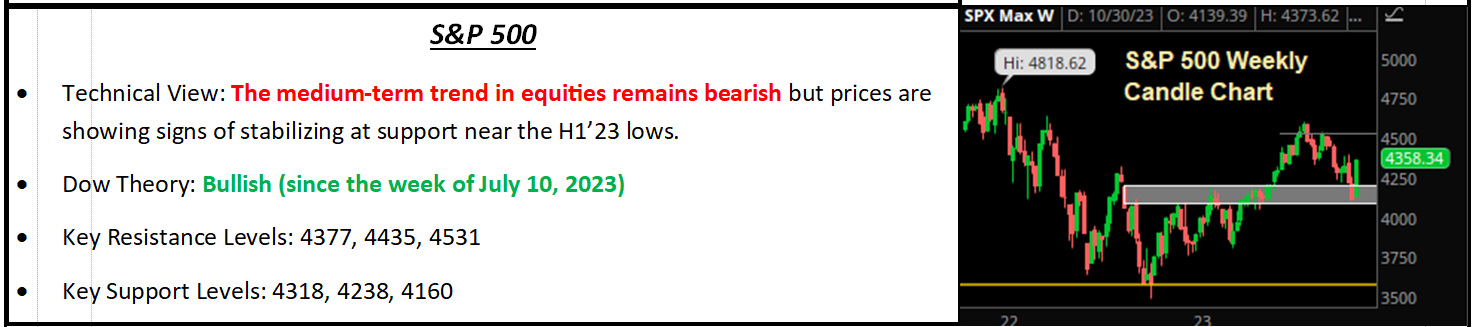
Things Were Not That Bad, But We Are Not Sure They Are Suddenly This Good
Over the past two weeks, when the S&P 500 hit the lowest level since May, we received criticism for not being overtly bearish. Instead, we pointed out that most of the factors pushing stocks lower (surging yields and rising geopolitical risks) were likely temporary and did not invalidate the medium-term supports for this market (the “Three Pillars” of the rally, i.e., soft landing, disinflation and the Fed almost done with rate hikes).
Last week, markets were reminded forcefully that those Three Pillars are still in place, and due mostly to short-term oversold technical conditions and suddenly a very negative investor sentiment. Markets rallied hard with the S&P 500 producing its best week of the year so far. In doing so, the S&P 500 essentially started the week at the lower end of the recent trading range (sub-4,200) and ended it at the upper end of the recent trading range (around 4,350ish). As mentioned in the headline, things were not that bad on Monday, but we do not think they were that good on Friday.
The week’s rally was due to the Fed signalling it is likely (but not absolutely) done with rate hikes. This means the avalanche of Treasury sales will be slightly smaller than feared and (this is new) the economic data is suddenly starting to show what has been the theme of the Q3 earnings season: The economy may not be as strong as the backwards-looking data implies.
It is to that point that our investment team wants to emphasize the realization of stocks going higher and falling rates on the back of suddenly worsening economic data, will not get the S&P 500 to 4,400 or will it hold 4,300. If economic data is starting to roll over, then it is not an exaggeration to say we may be only approaching the most “dangerous” time of the year, from a performance standpoint.
Now, we do not have a crystal ball and neither do you, but the point here is clear: If economic data is starting to roll over, then 1) Treasury yields will no longer be an influence on markets, 2) Economic data, not the Fed or yields, will become the main driver (so we need someone watching the data, which we will) and 3) Despite the market’s euphoric reaction last week, the downside risks will grow.
Positively, we cannot say that is going to happen—we must watch the data and will tell you, as quickly as we can, if data is signaling that slowdown because if it does that will be a reason to get more defensive.
From a tactical standpoint, there are better ways we can make ourselves look foolish beyond short-term timing calls, so that is not what we are going to do. However, we will say that if our clients were in acute pain and anxious about the risk of loss two Friday’s ago when the S&P 500 was at 4,200 now is a great opportunity to reduce volatility or de-risk. If we were worried about a growth scare, then Treasuries are still attractive here and we continue to think defensive sectors work.
Bottom Line: This is a market searching for “what is next” and that could be either 1) A growth scare or 2) A resumption of the soft landing and disinflation narrative that push stocks higher into Christmas. We will all find out together via the data. Given this is a market searching for “what is next” and not riding a wave of sustainably new information (positive or negative), then that will keep us skeptical of either extreme in the current trading range, and that includes reminding us that fundamentals did not turn that bad two Friday’s ago (and as such the market reaction was extreme to the actual events) and that bad economic data does not mean stocks should trade near the high end of the range, either.
Economic Data
What You Need to Know in Plain English
The past week saw Goldilocks economic data that contributed to a strong rally in both stocks and bonds. The key report, the jobs report, was deemed “Just Right” with a moderate increase of 150k jobs, although the September data was revised downward. The unemployment rate rose slightly to 3.9%, and wage increases were slightly below expectations. This data fell within the “Just Right” range, causing a positive reaction in futures and a decline in Treasury yields.
In addition to the soft jobs report, other labor market indicators, such as initial jobless claims and continuing claims, suggested a slight easing of labor market tightness, which is viewed as positive. However, a significant increase in continuing claims could be a concern.
Regarding growth data, the October ISM Manufacturing PMI dropped to 46.8, indicating a decline from the previous month, but not at new lows for the economic cycle. New Orders, a leading indicator, also decreased, hinting at further growth softening. While impacted by labor strikes, if this trend continues, this may be the reason for growth concerns.
Lastly, the ISM Services PMI declined to 51.8, slightly below expectations, with details showing a decline in activity. However, the rise in New Orders indicates that activity is not completely collapsing.
Bottom Line: Last week’s economic data was an important reminder that a soft landing is the most likely scenario and that is an important support for markets. The remainder of that helped fuel last week’s large rally.
Two notable reports this week are Consumer Credit (on Tuesday) and jobless claims (on Thursday). Regarding consumer credit, our investment team will want to see if credit cards and other short-term, unsecured credit increases. If so, that will imply that “excess savings” for the consumer are still being diminished and increased credit (at high rates) is being used to fund the difference, meaning that consumer spending could be set to ease in the coming months.
Turning to jobless claims, a particular focus will be on continuing claims. If they rise much above last week’s 1.82M they will have hit the highest level since December 2021. That is notable because layoffs are not occurring broadly if unemployed people are having a harder time finding work, which would be a likely leading indicator of leaving future labor market softness.
Commodities, Currencies & Bonds
“Commodities declined modestly again last week thanks to a sharp drop in oil prices, as the geopolitical risks in the Middle East receded and worries about global growth grew.”
Gold
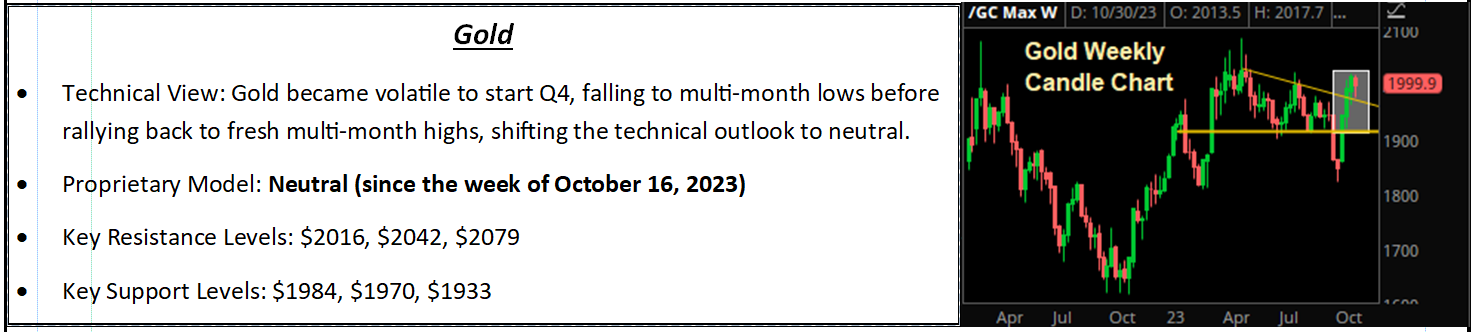
In the realm of precious metals, the rally in gold and other metals recently paused, despite a modest rise in the dollar and falling interest rates.
Looking ahead for gold, the outlook has improved since early October, but it has yet to surpass the May closing high of $2,059. Until that level is achieved, a neutral stance on gold is maintained.
In the last two weeks, several factors have halted the increase in Treasury yields. First, the Republicans elected a new Speaker of the House, which has improved government functionality. Second, the Treasury refunding schedule turned out to be less burdensome than anticipated, reducing the amount of debt to be sold. Third, Powell and the Fed emphasized that while rate hikes are possible, they would require a high threshold. Finally, recent economic data indicated a slowing economy.
The 10-year yield fell to a six-week low while the 2-year yield retraced the entire August-October increase in yields. The 10-year yield, however, remains about 50 basis points above the August levels (when the rise in yields truly began) so the sooner the 10-year yield can retrace the balance of that move, the better.
Oil Market Update
The oil market faces a complex landscape. The continuous rise in domestic oil production has offset the impact of OPEC+ output cuts led by major producers like Saudi Arabia and Russia. Furthermore, fading long-term demand expectations, as indicated by disappointing global economic reports, raise worries about the market tipping into a surplus in the coming months. The ongoing Israel-Hamas conflict remains a significant factor, keeping short-sellers on alert due to the threat of disruptions in oil production, infrastructure, or logistics. Despite a temporary easing of geopolitical fears, the market remains vulnerable to substantial short squeezes.
Special Reports and Editorial
What the Fed Decision Means for Markets
Last week was catalyst-filled for markets, and it had the potential to remind us of two key points. Firstly, a soft landing is still the most likely outcome and secondly, the Fed is likely done with rate hikes. So far, that is exactly what has happened, and stocks have rallied hard as a result. The recent metrics implied a soft landing and while it was not perfect, it was “good enough” to remind us that the economy remains in solid shape.
Turning to the Fed decision, as expected, neither the statement or Powell directly signaled rate hikes are finished, but they did convey a message that the “bar” for additional rate hikes is higher at this point than it was in September (and since the rate hike campaign began). That reminded our team that the Fed is likely done hiking and that also pressured Treasury yields and boosted stocks.
Finally, markets got an added boost when the Treasury Department released its estimate of the money it needs to raise via Treasury sales over the coming quarter, and the numbers were less than expected. Additionally, the Fed revealed it would reduce long bond issuance in favor of shorter-duration paper and stated there should only be one more quarter of elevated Treasury sales. That also helped to push yields lower and stocks higher.
Our investment team has maintained that as long as the “Three Pillars” of the rally remain in place (soft landing, disinflation, Fed almost done) then the chances of a material drop in stocks are slim, and despite the short-term risks from geopolitics and the spike higher in yields, we have maintained that opinion and will do so until one (or more) of those pillars is destroyed.
In the very short term, headlines will likely keep volatility elevated and earnings season is creating a valuation risk. For the S&P 500 to continue to trade above 4,300 we will need positive geopolitical and domestic political headlines, but beyond the short term, the net impact of the Fed meeting (and all of this week’s news so far) is to imply that the S&P 500 should remain largely rangebound between 4,350ish on the high end and 4,200ish on the low end, until such time as those “Three Pillars” are either no longer needed or are destroyed.
Post-FOMC Technical Levels Update
With markets making big moves since the Fed decision on Wednesday, our investment team wanted to follow up on some of the key technical levels. The S&P 500 closed Wednesday above the initial resistance level of 4,225 that would be in focus after the Fed decision while the VIX closed Wednesday handily lower than Tuesday’s settlement of 18.14 (down 7% on the day) indicating a clear easing in volatility/hedging activity. That combination of technical developments opened the door for the S&P 500 to make a run at the next key resistance zone between 4,330 and 4,380 but interestingly, the S&P 500 stalled at 4,320 in the final hour which happens to be the midpoint of the current target range.
The 10-year yield, on the other hand, came within 3 basis points of the October closing low of 4.595%, a key near-term level to watch, while gold held within the initial support ($1,970) and resistance ($2,022) levels. Based on the price action, the collapsing VIX is consistent with a continued move higher in stocks near term with the upper bound of secondary resistance in the S&P 500 at 4,380 becoming an important “line in the sand” for the bulls to push beyond. To the downside, the previous resistance at 4,225 will now offer the S&P initial support.
Bottom Line: Last week’s events reaffirmed the likelihood of a soft landing for the economy and the Fed’s probable halt on rate hikes, leading to a strong stock market rally. Economic data supported a favorable outlook. In the short term, market volatility may persist, but the S&P 500 is expected to trade within a range of 4,200 to 4,350. Technical levels suggest the potential for a further stock market rally with lower volatility.
By Vann Equity Management