

Highlights
Key Takeaways
- Weekly Market Preview: Separating Short-Term vs. Longer-Term in this Market
- Weekly Economic Cheat Sheet: Important Context for Economic Data Going Forward
- Oil Market Update
- Special Reports and Editorial:
- The Bull Case vs. The Bear Case
- Bullish or Bearish? My Analysis
- Bull vs. Bear Case: What Does This Mean for Markets?
- What Should Outperform In that Environment in Q1/H1
- OPEC+ Decision Takeaway
Stocks
“Stocks rallied again last week thanks mostly to dovish Fed speak, specifically comments for Fed Governor Waller that policy was appropriate (meaning no more hikes) while Fed Chair Powell did not refute those sentiments. Market priced in a greater likelihood of rate cuts in early 2024.”
✓ What’s Outperforming: Growth factors, tech, consumer discretionary and communication services, the worst performers in 2022, have outperformed YTD. However, higher yields remain a headwind and as such we do not think this outperformance will last over the longer term.
✓ What’s Underperforming: Defensive sectors and value have underperformed YTD but are still massively outperforming since the bear market started in 2022, and since our primary concern in 2023 is economic growth, we think underperformance will be temporary.
S&P 500
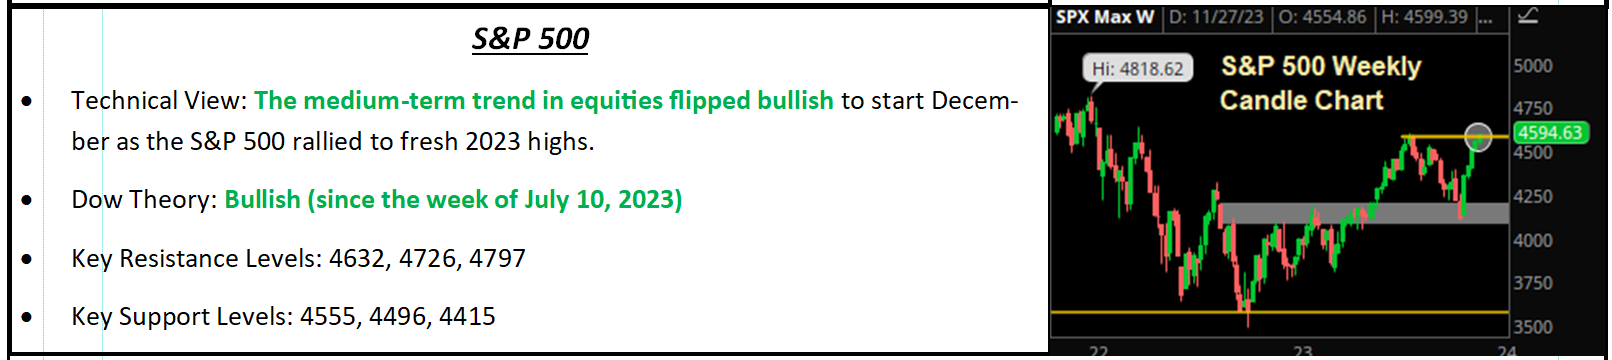
Separating Short-Term from Longer Term
We learned early in our career that end-of-the-year trading, especially when it was a good year with solid returns, was “different.” We say that because once Thanksgiving comes into view, traders simply wanted the year to end quietly, with no surprises, and solid gains. The net result is that markets tend to temporarily “ignore” any data or commentary that might jeopardize the gains (as long as it is not too bad) and embrace any data or commentary that helps the bullish narrative, into year-end. We think we are in the midst of that right now and as such, barring a major negative surprise from the jobs report or next week’s Fed meeting, we would not be surprised to see the S&P 500 drift sideways to modestly higher into year-end, almost regardless of headlines.
However, as we look beyond the near term, there is an important issue developing and we want to make sure we all properly understand it. The drop in Treasury yields has been precipitous. On Aug. 1, the 10-year yield was 4.03%. Over the next three months, it rose to a high of just over 5%. Then, in essentially five weeks, the 10-year yield has given back those three months of gains and now sits at 4.25%. Markets have aggressively embraced this decline in yields as signaling that the Fed will cut rates sooner than later and the cuts will be deeper than expected. That powered stocks higher in November.
However, the sharp decline in yields could also be signaling something else: A slowdown in growth. Put more directly, why are yields falling so fast? Is the Fed really going to get that dovish? Or is the bond market pricing in a sudden slowing in growth?
As we look forward toward the start of 2024, when markets snap out of this “year-end” temporary fog, that question will be the most important facing investors. Right now, markets think the answer to that question is “Yields are signaling a dovish Fed and not a slowdown.” If that answer starts to shift in early 2024 (which it could via economic data) then the decline in yields will shift from a market virtue to a market vice. That is what we will be focused on as we begin the new year.
Economic Data
What You Need to Know in Plain English
As we start 2024, for economic data to be good for stocks and bonds, it has to increase rate cut expectations while simultaneously not increasing hard landing fears. That is an important difference from 2023 when economic data mostly just had to not increase hard landing fears (remember the consensus view at the start of last year was for an imminent recession, so good economic data was welcomed until very late in 2023).
Here are why these matter: Economic data now had a narrower band to be considered “good” for markets than before and while investors can look past any disappointing economic data between now and year-end, the fact that it is a tighter range for good economic data going forward is important as we start 2023.
Think of it this way… If we are in a plane and it is coming in for a landing and we are at 5,000 feet, the margin for error is a lot greater than it is when the plane is about to land and at 500 feet. Using the plane as an analogy for the economy, data has started to show that the economy is losing momentum (so the economic plane is descending). So, the economic plane is coming in for a landing and now it gets tricky for the pilots (Fed) to pull off a soft vs. hard landing.
For the past several weeks the message of most economic reports has been that economic growth is starting to lose momentum and that was largely reinforced by the data last month. Positively for markets, the data was not bad enough to spike hard-landing worries and dovish Fed speak helped push yields lower and support stocks; but make no mistake, data is starting to point towards a loss of economic momentum.
The start of December contains numerous important reports, the most important of which is Friday’s jobs report. There are a growing number of anecdotal indicators that imply the labor market is starting to cool and as such, markets will be looking for another subdued job adds number like we saw in October to reinforce the idea that the Fed will cut as early as March, but the economy is not rolling over.
The second most important economic report comes Wednesday via the ISM Services PMI. Put simply, when the ISM Manufacturing PMI and the ISM Services PMI both drop below 50, that usually means a significantly slowing economy. Last month, the November ISM Services PMI dropped to 51.8, which is the lowest level since March and the second-lowest reading since the pandemic. If we see that PMI drop closer to 50 (or even, fall below 50) that should increase the anxiety that the economy is starting to lose some real momentum.
Most of the other potentially market-moving economic indicators focus on employment and inflation. JOLTS (Job Openings and Labor Turnover Survey) come on Tuesday, and ADP (Wednesday) and jobless claims are released on Thursday. Again, with employment strong by virtually any measure, there is room for softening in the data without increasing hard landing worries, and that is what markets will want to see (as it will increase rate cut expectations but not hard landing fears). Practically, that means JOLTS are down toward nine million, ADP job adds are in the low-100k range and jobless claims moving towards 250k.
Dovish expectations have underwritten the November rally, so those expectations need to be continuously reinforced by economic data going forward, otherwise markets risk giving back a large part of that big rally.
Commodities, Currencies & Bonds
“Commodities were mixed last week as metals rallied on a weaker dollar while oil pulled back on emerging discord among OPEC+ members. The long-term outlook remains neutral for commodities as the pullback in the Dollar Index has been a strengthening tailwind for the space, but the threat of recession weighing on demand is capping gains.”
Commodities were mixed last week as the OPEC+ decision was negatively received by oil traders while a continuation of the November weakness in the dollar saw metals rally with gold notably hitting a record high on Friday.
Gold
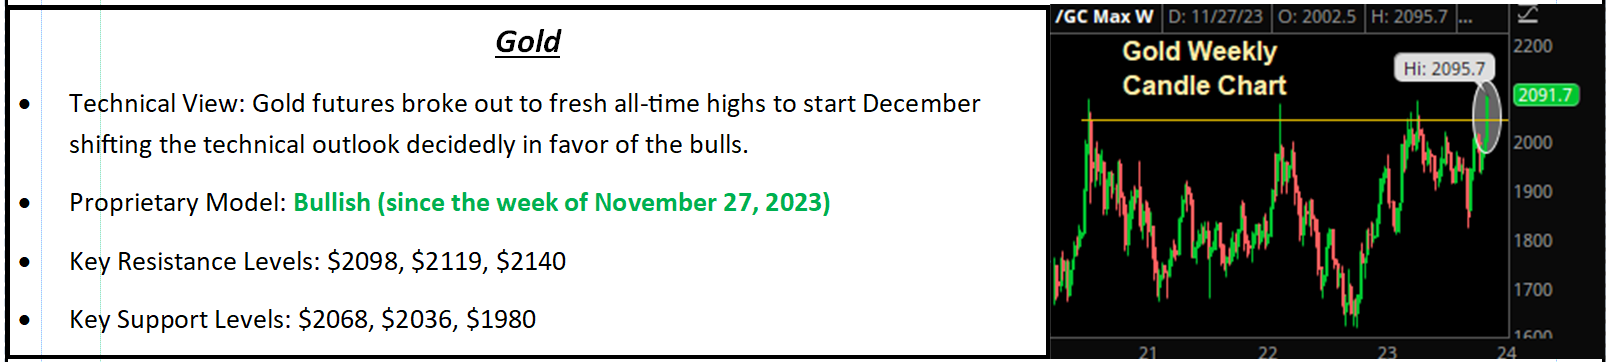
The gold futures contract for February expiration ripped 5.46% last week to a new all-time high for an active month futures contract but notably remained below the February contract record high of $2,140 from earlier this year. That will act as initial resistance for gold in the near-term. The new highs in the active-month contract were bullish for gold across all time frames and with the dollar still trending lower and Treasury yields well off cycle highs now, the fundamental outlook supports the case for a further run to the upside in the months ahead.
Oil Market Update
Oil has really been in the commodity spotlight all year as prices have been historically volatile amid OPEC+ surprises, geopolitical tensions, and deteriorating demand expectations, and WTI futures fell 2.23% last week to end Friday just off the November closing low of $73.13. OPEC+’s meeting decision on Thursday failed to impress oil traders as total output cuts were near the expected 2 million barrels/day on paper but roughly 1.3MM bbls of that was just an extension of the current output curbs by Saudi Arabia and Russia.
Additionally, the modest new cuts by other nations were to be “voluntary,” implying they would not be as tightly regulated and monitored by the group. The addition of Brazil to OPEC+ was mildly bullish as it adds a top-10 global oil producer to the group and added oil supply to the total “pool” that can be limited, but it was not enough to offset the disappointment of the smaller-than-anticipated production cuts.
Bottom line
Oil ended the month lower as traders appear to be pressing OPEC+ for more concretely bullish policy action, and if they fail to deliver, a test and potential violation of the 2023 lows near $67/barrel will become increasingly likely.
Special Reports and Editorial
The Bull Case vs. The Bear Case
Numerous Wall Street firms are unveiling their 2024 S&P 500 targets and as we were reviewing many of them over the past several days, we thought it would be helpful to lay out the bull case underlying positive forecasts, the bear case underlying negative forecasts, and which one we think is more likely.
While outlining the bull and bear cases is a consistently helpful exercise, this also has a very practical application, as, “Are you bullish or bearish” is a question we are asked constantly by people. Having a confident, direct answer (that explains why) can create conversations that ultimately lead to new clients, and we hope this analysis can aid in those conversations.
What The Bulls Think Will Happen
The bullish argument for stocks can largely be summed up by this statement: Everything that is already priced in happens.
We say that, because most of the year-end 2024 S&P 500 price targets are in the 4,700-4,800 range, which reflects some modest upside from current levels and, largely, a partial fulfilment of our “Gets Better If” scenario from our monthly Market Multiple Table. More specifically, if we are bullish, here is what we need to believe:
- No economic slowdown: Yes, growth should moderate (and probably will). However strong consumer spending and robust employment provide major support for the economy. So, while growth may slow, it will not meaningfully contract, and as such, the economy would not become a headwind on risk assets.
- Inflation continues to decline: Essentially, the entire 2021-2022 spike in inflation was caused (mostly) by supply chain issues and even if “Greedflation” has kept prices higher than they otherwise would have been, the mild slowing in growth will lead to companies cutting prices to keep market share, and inflation will continue to gradually drift lower.
- No hawkish surprises from the Fed: Importantly, we do not need rate cuts for the S&P 500 to rally in 2024. Instead, we just need the Fed to not provide any hawkish surprises and let expected growth (slowing but stable) and declining inflation put consistent downward pressure on Treasury yields. That decline in yields will 1) Support economic growth and 2) Keep a market multiple elevated, paving the way to higher stock prices in 2024.
- No reduction in earnings: If 2023 has taught us anything, it is that U.S. corporations are better than we thought at maintaining the bottom line through cost-cutting, as despite some evidence of slowing growth, corporate earnings have remained robust. That will continue in 2024 as A) Growth will not be so bad as to become a structural headwind on earnings and B) Corporations still have ample room to increase productivity and reduce costs. As such, 2024 expected earnings will remain around $245/share.
The net takeaway is this: The 2024 macroeconomic environment will allow the S&P 500 to trade around 19X 2024 earnings ($245/share), which equates to somewhere between 4,655 (19$245) and 4,778 (19.5245) and this logic and math is how most Wall Street strategists are coming up with their 4,700-price target.
Now, if that list of four bullish beliefs sounds familiar, it should. That is because those are, essentially, the “Three Pillars” of the rally plus stable earnings. Put differently, for this bullish belief to be true we need to see all the positive expectations that were pulled forward in 2023 actually happen; and if that is the case, we can expect between a 2% and 5% return in the S&P 500.
Frankly, that is not the most riveting or exciting bull case. And buying stocks for a 2%-5% return when we can get 5% in a high-yield savings account with zero volatility is not exactly attractive.
So, if someone is really bullish here, we think they need to expect more return potential. So, we are providing a more aggressive list of bullish beliefs, because if you are bullish then you really need to think the following will happen:
- Immaculate disinflation occurs in 2024: Immaculate disinflation is the idea that inflation falls quickly, and growth does not slow at all. This is different from the more negative consensus view that inflation gradually declines in 2024 while growth also slows but does not contract. Instead, immaculate disinflation means inflation falls quickly by itself and that economic growth stays resilient. This makes sense because it is possible all the inflation of the past two years was supply chain driven and now that supply chains are mostly working again, all that inflation will reverse itself and we will go back to a 2019 type of inflation. Meanwhile, growth will not slow. It will remain resilient and power corporate earnings higher.
- The Fed cuts rates, but not because of slowing growth: Immaculate disinflation is so important because it is the only scenario where the Fed cuts rates not in response to slowing growth (that is the consensus reason for Fed rate cuts) but instead because inflation has been vanquished. So, with inflation back on target the Fed can quickly drop rates to a less-restrictive stance, thereby aiding risk assets like stocks.
So, what does this look like from an indicator standpoint? First, core CPI back below 3.0% y/y by midyear and, second, rate cuts by midyear 2024, with 75-100 bps of cuts by December (if not more).
So, how bullish is this? In this scenario, a 20X S&P 500 multiple would be justifiable and earnings expectations would rise for 2024 (perhaps to $250). That makes the S&P 500 at 5,000 attainable with risks to the upside. That is a 10% return from current levels and again, risks there would be to the upside, especially as earnings estimates shifted to 2025 after July of next year.
The consensus bullish scenario is basically just a fulfilment of what has already been priced into stocks in 2023 and that will result in a modest gain in stocks. However, there is a more aggressive (and positive) scenario lurking out there and to take the risk of being long stocks, our Investment Committee thinks that bulls need to believe in that more aggressive scenario because if it happens, we should expect another year of double-digit stock returns and substantial new all-time highs.
What The Bears Think Will Happen
The bearish argument for stocks can largely be summed up by this statement: Everything we were worried about for 2023 (when most analysts were bearish) actually happens in 2024. We say that, because a lot of the 2023 rally in stocks can be explained by a “not as bad as feared” situation, and not a series of materially positive surprises. So, for stocks to roll over from here, all that has to happen is the worries of 2023 occur because all remain possible.
- Economic growth does not just slow, it contracts: There are no absolute certainties in the markets, but if there was a near certainty, it is that high-interest rates slow growth. And with the Fed having finished the most dramatic rate hike cycle in decades and interest rates at multi-decade highs, the duration of these higher rates will cause first a slowing of growth (likely happening now), and then later in 2024, an outright contraction. That contraction will validate classic recession signals we have had such as the inverted yield curve.
- Inflation stabilizes and does not decline further: The easy part of disinflation was CPI going from an absurdly unsustainable 9% to something more normal like 3%-4%. But with companies and consumers now used to higher prices, the last bit of the inflation decline will be difficult to manufacture. So, while inflation is not going to bounce back, it is not going to decline substantially either and it will stay solidly above the Fed’s 2% Core CPI target, which means…
- The Fed does not cut rates as expected, making “higher for longer” a reality: Inflation still solidly above target will prevent the Fed from materially cutting rates in 2024. Yes, a growth contraction will likely result in the Fed cutting rates. But stubbornly high inflation prevents any meaningful cuts and as a result, we have “higher for longer” rates, which only further pressures economic growth. The net result is stagflation.
- Corporate earnings growth disappoints: The market is currently pricing in nearly 10% earnings growth from 2023 to 2024, but given the looming economic environment, that earnings growth is too optimistic. Earnings growth will disappoint as companies face a slowing economy and run out of room to cut costs, absent layoffs (which just hurts revenue more).
What should we expect in this scenario?
This macroeconomic environment does not mean an epic market collapse, but it does mean that stocks are overvalued, investors are too optimistic, and the concerns of 2023 were not misguided, they were just early.
From a market performance standpoint, because the environment above is what was expected at the start of 2023, we can look to where the S&P 500 started 2023 as a guide. The S&P 500 started 2023 just under 3,800, so we think that is a reasonable downside target for the S&P 500 in this expected environment, which would represent a 16% decline from current levels. While that may seem like a long way from current levels, it was about a month ago that the S&P 500 was flirting with breaking 4,000, and the only thing that has changed since then is that markets view the Fed as being more dovish than expected. If that expectation is reversed and we have a growth contraction, do not expect the S&P 500 to hold 4,000 in 2024.
Bullish or Bearish? Our Analysis
As of now, several potential variables will determine, possibly, if the S&P 500 rallies through 5,000 or declines through 4,000, so it is fair to say the stakes are high. Those variables are 1) Economic growth, 2) Timing and size of Fed rate cuts, and 3) Earnings.
If the 20-plus years in the markets have taught us anything, it is that outcomes are usually not binary, so we do not normally get a universally positive resolution, nor does everything break bad, either. The truth is usually in the middle, and that is where our Investment Committee sits on the outlook for next year.
Unlike analysts trumpeting the S&P 500 above 5,000 and the bears warning about a looming calamity, as of right now we believe that 2024 will not be as good as the consensus expects it to be right now, but it is not going to be a catastrophe, either. Long before the age of QE and ZIRP (zero interest rate policy), markets were more nuanced and more volatile. In the end, more times than not markets drifted modestly higher, and we think that is a good expectation for 2024. Here is why (using each variable).
Variable 1: Economic growth
What we think: Based on recent data, we believe that growth will slow more than the consensus and perhaps slightly contract, but it will not collapse into a deep recession.
Why do we think it? Economic theory and practical experience are clear: The longer inflation remains high, the more it erodes discretionary spending, and that eventually slows growth. We are still working through the “eventually” part of it, but both the data and our anecdotal experiences tell us that the sustained high prices are now biting harder into consumer budgets, and that is likely to continue. Similarly, the utilization of previously low-interest rates has helped to cushion the impact of higher rates on the broader economy. However, the longer they stay high, the more of a weight they will present. With wage growth lagging behind inflation and rates still high, we do believe we are starting to see evidence of a clear loss of economic momentum in the coming months. There are, however, two important supports that we believe will prevent this from becoming a serious economic slowdown.
First, the Fed’s balance sheet is still massive and that provides a huge liquidity buffer against a more meaningful slowdown. The Fed’s balance sheet currently sits at $7.8 trillion. Pre-pandemic, it was $4 trillion. That massive liquidity boost (even after QT) provides a liquidity buffer that should help prevent a deeper economic contraction. Second, the labor market is too strong to imply a deep economic slowdown. Yes, employment is a leading indicator, but even if we see the unemployment rate rise a full percentage point through June 2024 (something that is very unlikely), it will still just be at 4.7%. That is historically very low and reflective of full employment. It is hard to have a deep economic slowdown without a major increase in the unemployment rate (i.e., above 5%).
Is this bullish or bearish? It is bearish, but only because the market is so richly valued. A stagnant or slightly contracting economy is not a recession. It probably equates to a 16X-ish multiple but not an outright disaster.
Variable 2: Fed rate cuts
What we think: The market is too aggressive in its expectations for Fed rate cuts both in timing (rate cut by May) and in size (100 bps in 2024).
Why do we think it? First, we did not think the Fed could reasonably cut rates unless core CPI is very close to, or under, 3.0% y/y and we are not confident that will happen in the first few months of 2024 unless we get a sudden and deep drop in housing or rent prices (which does not appear to be happening). Second, Arthur Burns. The 1970s Fed President is generally regarded as one of the worst because he cut rates too early, only to have previously thought-to-be-vanquished inflation bounce back. The Fed then had to hike rates again and that led to the stagflation of the 1970s and 1980s. The Fed has not made the same mistake twice (they make new mistakes) and as such, we think the Burns legacy looms large over Powell and the only way we get rate cuts by May is that growth is slowing more dramatically than markets expect.
Is this bullish or bearish? Moderately bearish. Most of the recent 500-point rally in the S&P 500 has been driven by the idea that the Fed will be cutting rates by May and that it will cut rates dramatically by the end of 2024. That is possible, but if that expectation must be reversed, then the S&P 500 could easily give back 250-350 of the recent 500-point rally.
Variable 3: Earnings
What we think: Earnings will grow in 2024, but not at the near-10% expectation currently priced on the markets.
Why do we think it? 2023 S&P 500 earnings will be around $225/share. Current expectations for S&P 500 earnings in 2024 are about $245/share. That is 9% annual earnings growth, an ambitious number for the consensus economic environment, even considering AI could continue to help boost tech earnings and we do not think earnings growth will get there. First, we think the slowing of growth will depress general consumer spending, which will be a headwind on earnings. Second, corporate America benefitted from the spike in inflation over the past few years as they were able to raise prices, increase margins, and suffer no demand loss. However, if you are like us, you are seeing evidence of disinflation across the spectrum: goods, electronics, airfare, travel, hotels, etc. Companies are once again competing for the price (remember those days), and we believe that will negatively impact corporate margins. So, we think companies can grow earnings in 2024, just not as aggressively as the market thinks.
Is it bullish or bearish? Mildly bearish. As we have covered in the past, movements in earnings estimates are not as impactful as movements in the market multiple. For instance, expected 2024 S&P 500 earnings falling from $245 to $240 just equates to a reduction in “fair value” for the S&P 500 from 4,655 to 4,560 using a 19X multiple, or about 2%. But it still matters, and this is a potential source of risk for markets as we start 2024.
Bull vs. Bear Case: What Does This Mean for Markets?
We want to be clear that we are not raging bears. The Fed balance sheet, a still relatively strong consumer, and strong employment are all positives that should help cushion any substantial drop in growth. But we will say that we are concerned that, in part due to the calendar and the push for a year-end rally, this market is now susceptible to disappointment in early 2024, not unlike it was following 2021 when stocks melted up into year-end only to be smacked across the face once the calendar rolled and they had to confront high inflation, slowing growth and a hawkish Fed.
We do not think this reaction will be that bad, but it does give us pause to see how markets are embracing the precipitous fall in Treasury yields right now. If that drop is the result of slowing growth and economic data begins to signal weakness, falling yields will be a warning sign of a looming economic slowdown, something that is not at all priced in with the S&P 500 at 4,500.
It is unlikely, barring a major negative surprise, that we see the type of volatility in 2024 that we saw in 2022. At the same time, there is not the negativity and bearish expectations in place that underwrote the 2023 rally. The net result, we believe, will be more volatile, especially at the beginning of the year as investors acknowledge a slowing economy and a less-dovish-than-expected Fed. Moreover, a return of September/October-type declines should not shock anyone. From there, the question will likely shift to: How bad is the slowdown? The answer will either 1) Make more downside possible or 2) Present a buying opportunity.
What Should Outperform In that Environment in Q1/H1
If we do enter an environment during the first quarter and first half of 2024 that is characterized by 1) A weaker-than-expected economy (that increases hard landing worries but does not collapse), 2) A less-dovish-than-expected Fed (so rate cuts eventually but not as soon as expected) and 3) Concerns about earnings growth, then the sectors and factors that should outperform will likely revolve around 1) Quality, 2) Value and 3) Minimum volatility/defensives.
Bottom line
Our outlook is not overtly bearish, but it is cautious based mostly on the market getting very optimistic on assumptions there will be no growth scare, no hawkish surprise, and incredibly resilient earnings. That could happen, and because of that, it makes sense to remain allocated to stocks. However, it also could not, which is why we think lowering beta and volatility to start 2024 makes sense, simply because a lot of good news is already priced into stocks and if markets do need to digest disappointing growth, earnings, or Fed commentary, the highest-quality earnings and relative value should outperform the high flyers and cyclicals.
OPEC+ Decision Takeaways
The postponed OPEC+ policy meeting for 2024 concluded last week, and in typical OPEC fashion, there were some unexpected and ambiguous developments. Ultimately the market was left with more questions than answers about future oil output from the group of global producers who account for about 40% of the world’s daily oil supply. The oil futures market initially rallied on reports that total OPEC+ output cuts were to be deepened by 1 million barrels per day in 2024, which saw WTI push up against the $80/barrel threshold. As the meeting outcome was digested, however, the less-certain details of the policy decision saw unconvinced speculative bulls retreat to the sidelines and prices turn negative by midmorning. WTI ended down 2.44%.
The first unexpected development from the meeting was the announcement that OPEC+ had verbally agreed to 1 million b/d in additional production cuts (beyond current voluntary cuts by Saudi Arabia and Russia), but formally, they only extended current output curbs into 2024. That means the extra million b/d in production cuts will be voluntary, announced individually by each member nation, and presumably self-regulated. Saudi Arabia and Russia were quick to announce their production cut plans with the former extending current voluntary cuts of 1.5 million b/d and the latter deepening output curbs of 300K to total 500K through Q1 2024. The lack of clarity on all OPEC+ voluntary cuts was a modestly bearish surprise and largely the reason the market rolled over after the meeting.
The second surprise was Brazil formally joining OPEC+. As of the end of 2022, Brazil was the ninth-largest oil producer in the world and by far the largest in South America with a daily output of 3.17 million barrels of crude oil per day. For reference, the same data showed Kuwait producing 3.01 million b/d and Iran producing 3.67 million b/d. The addition of Brazil was slightly bullish as there is safety in numbers and the more oil producers you have teamed up to support the market, the better. However, Brazil did not make it immediately clear whether they would cut production after formally joining OPEC+ in January, which left it a more neutral development for markets.
So, what is the takeaway from the OPEC+ meeting? On the surface, the answer is it was a mild disappointment as markets hate fundamental uncertainty, and having a handle on global oil supply trends is critical to stable energy prices. Stepping back and looking at the situation objectively regarding the parties involved and a simple risk reward for those making the decisions, the meeting should ultimately be bullish for prices. The reason is that OPEC+ cuts currently total just shy of 4 million barrels/day or around 10% of the group’s 2023 output, which has helped oil prices average around $80/barrel this year. Without those cuts, we would be looking at prices likely below $50/barrel or less than half of the 2023 highs. If OPEC+ were to abandon policy and begin to compete for market share, then the 10% increase in production would not nearly offset the $30+/barrel drop in prices. In other words, OPEC+ could maintain production cuts of around 10% and enjoy a revenue of $3.2 billion/day (40 million barrels x $80/barrel) or increase production to 45 million b/d (for the sake of ease) and collective revenue would plunge to $2.25B/day (45 million barrels x $50/barrel). So, getting into a battle about market share over a relatively small amount of output is the worst thing OPEC+ could do to themselves in this delicate demand environment.
So, while it is in OPEC+’s best interest to remain unified and disciplined, the group has been known to make decisions that are self-defeating (i.e., Thanksgiving 2014 disagreement resulting in oil crashing from $75 to $45 in a matter of weeks). As such, the market may pressure oil until it gets the proof or evidence needed to support a bullish fundamental oil backdrop.
By Vann Equity Management