

Highlights
Key Takeaways
- Relief Rally to 3800
- A Critical Week for Stocks
- Will the Fed confirm smaller rate hikes in the months ahead?
- Economic Data: Is the U.S. economy quickly losing momentum?
- Oil Market Update
- Special Reports and Editorial:
- A Tale of Two Markets?
- Are “Dovish Hikes” The Same Thing as a “Fed Pivot?” No!
- What the Political News from the U.K. and China Mean for Markets
Stocks
- Stocks rallied again last week thanks to the restoration of fiscal credibility in the U.K. and rising hopes that rate hikes will be smaller in the coming months.
There was a solid rally in stocks last week and there were two legitimate reasons for the higher prices. First, the trend of “dovish hikes” from central banks is apparently upon us….at least globally. The Reserve Bank of Australia kickstarted the beginning of October when they raised 25 bps instead of 50 bps. The WSJ then published an article two Fridays ago that added to the momentum HINTING at a 50-bps hike vs. the previous 75-bps expectation here in the US (but we do not think that to be likely). Finally the Bank of Canada hiked 50 bps vs. (E) 75 bps and the ECB hiked 75 bps as expected, but signaled that smaller rate hikes are likely coming in the months ahead!
Bottom line, none of this is a “Fed pivot” that we really need, but it is better than nothing and smaller rate hikes do reflect a less-hawkish outlook!
The second legitimate reason for the stock market rally is that earnings are NOT as bad as feared. Yes, the blowup in Facebook (META) and the disappointing results from MSFT, GOOGL and AMZN all hogged the financial headlines, but outside of tech, earnings are decidedly not as bad as feared, and that is reflected in the performance gap between RSP (the equal weight version of the S&P 500) which rose nearly 5% last week.
S&P 500
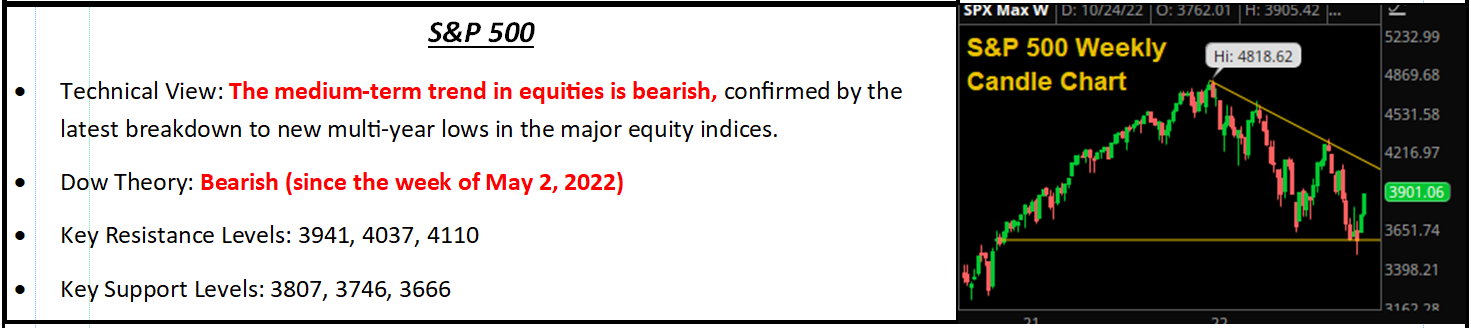
The rally of the past two weeks has now largely satisfied our expectation that we could see a relief rally towards 3,800 (currently 3870 at time of writing this) on renewed hopes of a looming Fed pivot (and indeed, as is usually the case, momentum has taken us beyond the levels we think are fundamentally justifiable). But while this price action is certainly better than what we saw at the end of September/early October (tech weakness notwithstanding), we think it is important to temper our enthusiasm and realize that, at these levels, the S&P 500 is now stretching the bounds of justification given the actual market reality.
What is our thinking behind that? First, dovish hikes are still hikes. Yes, the Fed may well decrease the intensity of its rate hikes starting in December; but it is still the terminal rate that really matters, and unless that drops ideally below 4.50% there is no real dovish shift from the Fed.
Second, earnings have been better than feared, but 2023 estimates are still under pressure. Most analysts penciled in $230 for 2023 S&P 500 earnings, but that’s holding by a thread, and we shouldn’t be shocked if that number drops to $225 or even $220 with risks to the downside. Taking that $225 number, the S&P 500 is trading at a 17X multiple. That’s about a “best-case” scenario given the current macro set up and we don’t think the environment has improved that much in the last two weeks.
We are happy stocks are solidly off the lows, but we still view this as a Bear Market Rally, and an opportunity to 1) Right size portfolios for continued volatility by adding to cash positions (or similar), 2) Diversify equity exposure to ensure over weights are defensive sectors and value over growth.
Looking forward, for any further gains to be fundamentally supported, we need to see:
- The Fed pivot and
- Inflation stats start to drop. Regarding the former, if Powell hints at a 50-bps hike in December at this week’s meeting that likely would cause a further rally (maybe towards 4,000 in the S&P 500) but we would use that rally to again right size exposure. Regarding the latter, a soft jobs number would help this week but really, we need to see CPI drop meaningfully and the next opportunity for that is Nov. 10.
Bottom Line
There has been some macroeconomic improvement, but our “Three Keys to a Bottom” remains unsatisfied. So, we continue to favor overweight allocations to cash and defensive sectors, and value as the most effective way to maintain long exposure and weather the continued market storm.
Economic Data
What You Need to Know in Plain English
To round the month out, data didn’t point at stagflation as strongly as the data from two weeks ago; but it did still hint at stagflation, and if it were not for the growing hope that central banks will start to slow rate hikes in the coming months, the data would have weighed on stocks more.
Starting with the growth metrics, they weren’t good. The October PMIs (both manufacturing and service) fell below 50 at 49.2 and 46.6, respectively, marking the first time both have signaled contraction since 2020 (the depths of the pandemic). Additionally, within the September Durable Goods report, New Orders for Non-Defense Capital Goods ex-Aircraft (NDCGXA) fell -0.7% vs. (E) -0.2% and that was after the August data was revised lower. That matters because NDCGXA is the market’s best proxy for business spending and investment, and if that’s starting to dry up then we are looking at increasing headwinds on economic growth. Bottom line, there are clear signals from the economic data that the U.S. economy is losing momentum and that will continue, and again it should not surprise any of us as palpable signs of a slowing economy appear in the coming months.
On the inflation front, the data wasn’t as bad as two weeks ago, but it wasn’t exactly good, either, as the inflation data showed inflation remains sticky (but at least it isn’t getting any worse). The key inflation report, the Core PCE Price Index, rose 0.5% m/m and met expectations while the year-over-year number was slightly better than estimates (5.1% vs. (E) 5.2%). The Employment Cost Index, which is one of the Fed’s favorite measures of wage inflation, slightly underwhelmed and rose 1.2% vs. (E) 1.3% m/m and 5.0% vs. (E) 5.1% y/y. Finally, the input prices sub-index in the flash manufacturing PMIs rose slightly.
In sum, these aren’t “bad” inflation numbers, as they didn’t imply inflation is getting worse. At the same time, they’re not showing inflation is declining rapidly either, and as such, we have clearly slowing growth amidst a buoyant inflation environment. That is stagflation if it continues.
Important Economic Data This Week
This week is full of potentially important events and it is not an exaggeration to say that the events of this week could result in another 5% rally in the S&P 500, or a give back of a lot of the gains of the past two weeks (and possibly a test of the lows).
The key event this week is Wednesday’s FOMC meeting and the key will be if the Fed or Powell hints that rate hikes going forward will be smaller than they have been (so 50 bps vs. 75 bps). That is what has helped the market rally, so any confirmation of that could create more short-term upside, although the bigger issue will remain the level of the “terminal-rate.”
The second most important event is usually the most important event during the first week of each month: The jobs report. The labor market remains much too tight for the Fed’s liking; and while we are starting to see a slowing of economic activity, the labor market remains very strong. That must change if we are going to get a Fed pivot sooner than the market currently thinks. We must see deterioration in the labor market for the Fed to feel more confident that inflation has downward momentum.
The third most important events this week are the ISM Manufacturing PMI (tomorrow) and the ISM Service PMI (Thursday). Inflation needs to fall faster than economic growth, otherwise we have got stagflation and that is not good for stocks at these levels. So, if the ISM PMIs can stay buoyant and not mirror the drop we were seeing in the flash PMIs, that will give markets some confidence that growth remains resilient and it will be a positive for stocks, especially if the price indices decline further.
Bottom Line
Stocks have rallied on the hopes of smaller rate hikes on the horizon and resilient U.S. economic growth, and that will either be confirmed this week (and stocks can extend the rally) or contradicted (and if that happens, don’t be shocked by a quick 5% pullback).
Commodities, Currencies & Bonds
- Commodities were mixed last week as oil posted solid gains, rising along side other risk assets amid renewed peak-inflation hopes while industrial metals declined on negative news flow out of China and gold pulled back on declining inflation expectations.
WTI crude oil futures rallied 3.81% last week thanks to the combination of general risk on money flows amid new peak inflation hopes and government data that pointed to strong demand and tight supplies. The weekly EIA report showed oil exports jumped to a new record high amid strong international demand while a domestic measure of implied demand rose to the highest since August. With the refinery utilization rate well off the summer highs, current trends suggest refined product supplies could get even tighter, and that helped oil prices rally toward the upper end of its recent trading range. The price of oil is still rangebound between support at $78 and resistance at $93/barrel as the “Biden put” (his recent announcement that the DOE will begin to buy back oil for the SPR on dips towards $70/barrel) is keeping a bid under the market while lingering concerns about a looming global recession are capping upside moves.
Gold
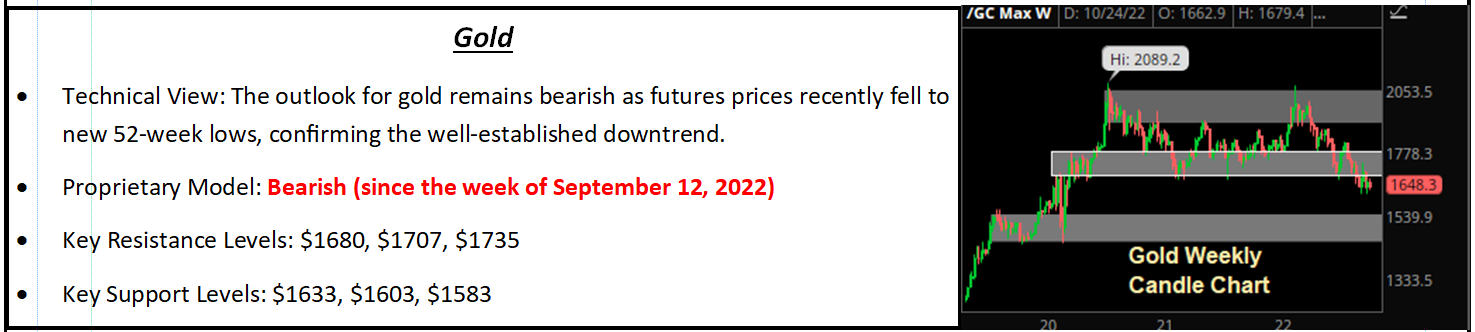
Gold prices declined 0.85% last week despite a pullback in the dollar and a drop in Treasury yields. Digging deeper into the market internals, market-based inflation expectations, specifically the 5-Yr TIPS Breakevens, pulled back following inflation data that came in mildly lower than expected over the course of the week. Looking ahead, the trend in gold is still lower and the fact that futures couldn’t rally in the midst of a weaker dollar and drop in interest rates last week is discouraging. Fundamentally, the longer-term uptrends in the dollar and rates remain bearish headwinds for gold leaving the path of least resistance lower.
Turning to industrial metals, copper fell 1.35% last week following the conclusion of China’s People’s Congress during which Xi Jinping reiterated the government’s commitment to its zero-Covid policy. That weighed on demand expectations especially considering that concerns about the global economy are on the rise. Going forward, we will continue to watch copper closely as a new breakdown in prices would underscore deteriorating economic expectations and likely renewed pressure on risk assets globally.
Oil Market Update
EIA Data Takeaways and Oil Update
The weekly EIA inventory report was a mixed bag but assessing both the headlines and the details provided a mildly bullish outlook for the near term and WTI futures rallied accordingly in the wake of the release.
On the headlines, commercial crude oil stockpiles rose by +2.6MM bbls vs. (E) +600K last week but undershot the API’s reported build of +4.5MM bbls while gasoline inventories fell by a more-than-expected -1.5MM (E: -900K), which was, on balance, slightly bullish.
In the details, refinery use was expected to hold steady at 89.5% but fell to 88.9%, which is a near-term negative for oil demand but suggests tightness in product markets could worsen in the weeks ahead. That was compounded by data that showed the four-week moving average of gasoline supplied, an implied measure of demand, rose to the highest since late August. Furthermore, crude oil exports jumped to 5.1MM b/d last week, a new record high that sent net imports to a record low.
More oil is leaving the country than ever before, commercial oil stockpiles rose by a lower-than-feared amount, and gasoline demand is seen firming while supplies are historically low. Those influences and broader domestic energy dynamics are net bullish for oil and the refined products near term, which appropriately sent futures prices back into the upper half of their recent trading range.
Looking ahead, that aforementioned trading range between support at $78/barrel and resistance at $93/barrel is still intact for now with the Biden administration’s “put” at $70/barrel acting as fundamental support while any move into the $90s will likely be capped by demand worries linked to recession fears.
Special Reports and Editorial
A Tale of Two Markets?
Last week poor tech earnings weighed on the major indices, but the reality is that, beyond the tech sector, the performance of the market has been good.
That’s best exemplified in the performance gap between SPY and RSP. SPY, which mirrors the S&P 500 and has tech as its largest sector allocation, was up a robust 3.95% last week. RSP, which is the equal-weight version of the S&P 500, has rallied 4.86% over the past week as earnings results for companies from more “traditional” sectors such as industrials, financials, and consumer staples, have largely been better than feared.
This performance underscores an important point: Tech may still be vulnerable to continued declines, but the more traditional parts of the economy, including sectors that trade at a lower valuation, are proving resilient since the board markets bounced some two weeks ago.
Stepping back, this market and the economy more broadly are starting to remind us of the 2000-2002 setup, where extreme tech weakness weighed on the major indices, but more traditional parts of the market and the economy performed better.
Bottom line, earnings season so far continued to advocate for overweight exposure to defensive sectors, low volatility stocks, and value more broadly, and as we approach what will likely be further deterioration in the macroeconomic environment, we continue to think those sectors are some of the best ways to maintain long exposure while at the same time insulating portfolios for further extreme downside.
Are “Dovish Hikes” The Same Thing as a “Fed Pivot?” No!
The number of central banks that have executed a “dovish hike” recently increased from one (the Reserve Bank of Australia) to two yesterday, as the Bank of Canada hiked rates just 50 bps, less than the 75-bps expectation. That smaller-than-expected rate hike caused U.S. stocks to temporarily rally last Tuesday.
Since the WSJ article suggesting the Fed may hike 50 bps in December, markets have rallied on the idea that the worst of the global rate hikes are either 1) Already behind us or 2) About to be behind us, and the BOC’s smaller-than-expected hike only furthered that sentiment.
We should expect more of these “dovish hikes” in the coming weeks and months (but not from the Fed, at least not yet) as global central banks (minus Japan) seem to be in general lockstep on policy since the pandemic (they all cut rates to 0% and enacted massive QE, and now are all dramatically hiking rates).
So, given the RBA hiked less than expected, the BOC hiked less than expected and we should expect more global central banks to slow rate the pace of rate hikes, does this mean we’re finally getting the “Fed pivot?”
No!
A Fed pivot represents this idea: The Federal reserve’s main goal shifts from just beating inflation, to containing inflation and supporting growth. Practically, that means the Fed signals that it is totally done (or will soon be totally done) with rate hikes.
Importantly, that is not what the BOC did. And it’s not what the RBA did two weeks ago. In fact, the BOC specifically signaled that while it hiked by “only” 50 bps, it will continue to hike rates into the future. That matters because while the BOC is reducing the intensity of rate hikes, its primary goal is still bringing inflation lower, so there hasn’t been a pivot.
Practically, here is why these matters. A Fed pivot will occur when the Fed, either via interviews, the “dots” or from Fed Chair Powell, clearly signals that rate hikes will end at a specific date.
That’s different than a slowing of rate hikes, which is what we are seeing. The difference is that central banks can slow rate hikes but extend the duration. For instance, if terminal fed funds is 4.75%-5.00%, is it better if the Fed hikes 75 bps in November, 75 bps in December, and 50 bps in January and is done? Or, what if they hike 75 bps in November, 50 bps in December, 50 bps in January, 25 bps in March and 25 bps in June? I’d contend the former is better because the sooner we get to peak hawkishness, the better!
Now, could less-intense rate hikes lead to a Fed pivot? Absolutely! But that will depend on inflation and specifically how quickly inflation declines. Obviously, we hope that’s sooner than later, but we wanted to be crystal clear that “dovish” hikes where the Fed might hike less than expected is not a Fed pivot and as such, we would not chase markets higher even if the Fed hints at 50 bps at next week’s FOMC meeting (stocks may rally on that, but we would be skeptical it’s sustainable until we get a real drop in CPI).
What the Political News from the U.K. and China Mean for Markets
Markets were driven last Monday by conflicting influences from foreign politics, namely Rishi Sunak becoming Prime Minster of the U.K. and Chinese President Xi securing a third term as party leader (and taking steps to effectively make him a dictator). Given the recent influence U.K. politics has had on the global markets (including U.S. interest rates) and the utter collapse of Chinese stocks surrounding Xi’s consolidating power, we wanted to cover each event and clearly identify what each means for markets.
Sunak Becomes PM. Market Impact: Slightly Positive.
Boris Johnson’s former Chancellor of the Exchequer Rishi Sunak will become the next Prime Minister of the United Kingdom today, and the net impact of this news will be to reduce market anxiety regarding the U.K.’s fiscal situation.
To bring us back to the start, the market revolted against Liz Truss’ spending and tax cut plan because it would have increased the U.K. deficit and further fueled inflation. The market voiced its displeasure via a massive spike in Gilt yields that then bled over into other government bonds (Bunds and Treasuries). The net effect was to put additional stress on virtually all global economies via a stronger dollar and higher yields.
However, much of that has been undone and market stress has relaxed materially, as Sunak is viewed by the markets as someone who won’t make that same mistake. In fact, Sunak specifically warned about the negative impacts of a plan like Truss-o-nomics during a speech earlier this year. Bottom line, the market thinks Sunak (who is an ex-Goldman Sachs employee) “gets” the markets and as such these surprising stimulus and tax cut plans won’t be coming anytime soon.
Key Variable to Watch: 10-year Gilt Yields. 10-year Gilt yields have essentially been the market’s barometer of U.K. fiscal stress. The greater the stress, the faster and higher Gilt yields rise. So, with Sunak now in charge, we’d expect Gilt yields to continue to fall and that should put at least a mild headwind on global yields, including Treasuries (which would be positive for stocks).
Last Monday, the 10-year Gilt yield fell 31 basis points and Gilt yields hit their lowest level since September. If the declines continue and 10-year Gilts trade down below 3.50% (and close to 3.00%) that will be a sign that all market fiscal anxiety has dissipated, and it’ll be a positive for U.K. stocks and the global bond market (i.e., lower global yields).
Xi Strengthens His Hold on Power. Market Impact: Potentially Negative.
We have long said that China is a country that’s run like a company, and keeping that analogy alive, Premier Xi essentially strengthened his hold on power and just became Premier/CEO of China for life. He did this by stuffing the “Politburo Standing Committee,” which is essentially like the “Board of Directors of China” with loyalists, as he rid the higher levels of the Chinese government of any potential detractors. This was done mostly silently, although the forcible removal of Xi’s predecessor, Hu Jintao, provided a stark visual demonstration of Xi’s tightening grip on power.
The market reaction to this news was not positive. First, Chinese stocks plunged as the Hong Kong-focused Hang Seng Index collapsed by 6% while the CSI 300 (the Shanghai Index) dropped by 3%. The reason for the declines in stocks was clear: A more powerful Xi means more of the same. And that “same” means: 1) Continued tech theft from the West that will keep tensions elevated and we should expect continued export component bans to Chinese companies, 2) Focus on domestic “Shared prosperity,” which is a noble social goal but not usually great for earnings, 3) A continuation of the Zero-Covid policy that has crippled China’s economic growth, 4) Continued geopolitical tensions with the West based on intellectual property and military movements (building islands in the middle of the ocean, etc.) and 5) Possible invasion of Taiwan. Bottom line, the last several years haven’t been great for China, the global economy, or Chinese stocks, and Xi solidifying power means we should expect more of the same, and that’s a negative for Chinese businesses and earnings.
Key Variable to Watch: The Yuan. Remember how the “bond vigilantes” targeted Gilts (by selling them) to show their discontent with economic policies? Well, if something similar happens, it’ll occur in the Chinese yuan, and it’s worth noting yesterday that the yuan fell 1.99%, the limit of the 2% band the PBOC allows the yuan to move in a day. If the yuan continues to weaken vs. the dollar, moving past 7.50 towards 8.00 (currently about 7.26) then anxiety will rise about a funding issue with China, and expect a lot of focus to turn towards China’s dollar reserves (they need dollars to buy yuan to keep the value inflated). Bottom line: The yuan is important in light of last Monday’s market moves and if we see a continued weakening (or an acceleration in that weakening) that will increase global macroeconomic anxiety, so this is absolutely a risk we are watching.
Geopolitics has been an unwelcomed negative influence on markets throughout 2022, initially with the Russia/Ukraine war and then with the U.K. fiscal drama. If markets sour materially on China and we see a “run” on the yuan (something that’s possible but not likely) that will impose another headwind on global risk assets and U.S. stocks, so this is something we’ll be monitoring for you.
Written and produced by the Investment Committee members of Vann Equity Management.
By Vann Equity Management